The worst stock market crashes of all time
The world has experienced several major stock market crashes as a result of mass panic and a lack of confidence in stock values. We take a look at some of the worst stock market crashes and their impact on the global economy.

The worst stock market crashes of all time
- The Wall Street crash: 1929
- Black Monday: 1987
- The great recession: 2008
- The flash crash: 2010
- The OPEC crash: 2020
- Coronavirus crash: 2020
Why does a stock market crash?
Stock market crashes are driven by investor panic as much as any underlying economic factor. When investors lose confidence, it can lead to significant sales on a stock exchange and a resultant drop in prices that can trigger a mass sell-off. The increase in the volume of trades also exacerbates the fall in prices.
With the internationalisation of stock markets, and the emergence of electronic systems, crashes can now spread very quickly across the world, which can magnify the collapse of markets.
Crashes often occur after an extended period of buying pressure, when greed has driven stock prices so high that they are considered overvalued. Because these prices are unsustainable, the market can eventually crash. Although this pattern is well established, most economists agree that it is still difficult to predict a stock market crash.
However, you can prepare yourself for a crash and learn how to take advantage of the market movements they cause. There are a variety of ways to take action, including:
- Learning more about how to trade a stock market crash
- Finding out how financial markets work with IG Academy’s range of courses
- Practising trading market volatility in a risk-free environment with an IG demo account
- Opening a live account to start trading today
The biggest crashes the stock market has ever seen
Regardless of what caused them, stock market crashes can have an undeniable influence on global economic activity. However, it is important to note that not all market crashes have long-lasting economic effects. Some are just ‘flash crashes’, which are more short-term drops in the stock market.
We will take a look at a timeline of stock market crashes, and the economic impacts (if any) they have had on the world.
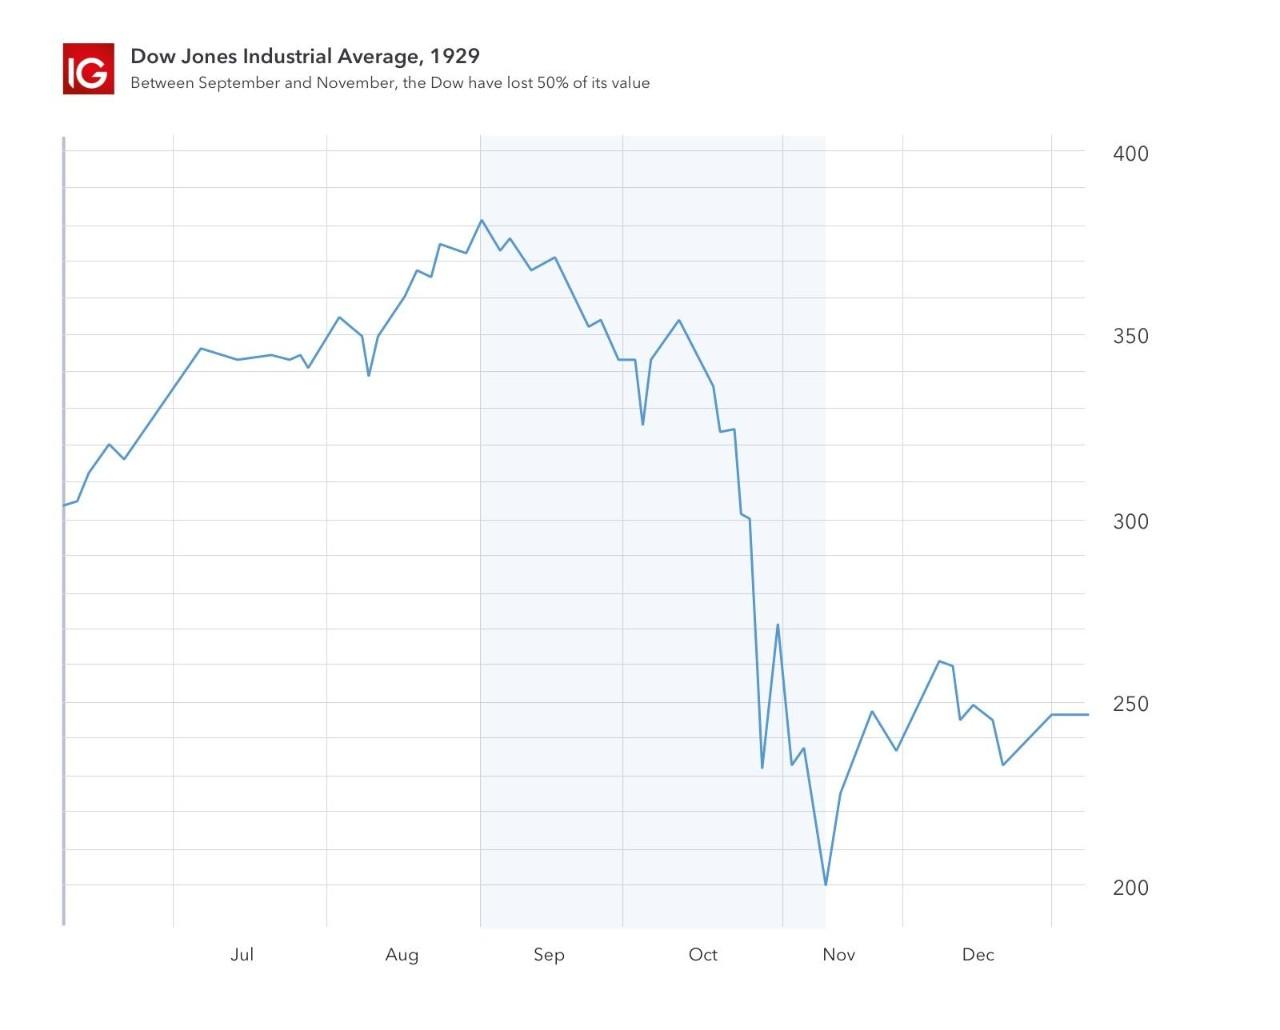
The Wall Street crash: 1929
The Wall Street crash of 1929 hit the New York Stock Exchange (NYSE) on 24 October. It is considered the most famous stock market crash of the 20th century, and the greatest crash in the history of the United States.
What happened?
During the 1920s, the United States and Europe experienced strong economic growth, and the increase in industrial production saw stock prices on the New York Stock Exchange rise by approximately 300%. This rapid growth caused investors to get greedy, as they focused on the possibility of buying stocks and reselling them for significant gains.
The period of wild speculation had caused unsustainable growth, which led to share prices becoming separated from the real value of the stocks. Inevitably, these expectations came crashing down when 12.8 million shares were put up for sale on the Wall Street exchange on 24 October (known as ‘Black Thursday’) – the sheer quantity caused stock prices to fall into a decline. On 29 October, or ‘Black Tuesday’, the NYSE had four times the normal trading volume as panicked investors took to the market to sell their shareholdings. The Dow Jones dropped by over 12%.
The crash marked the beginning of the ‘Great Depression’, a ten-year recession that impacted most westernised economies, and resulted in widespread poverty and unemployment.
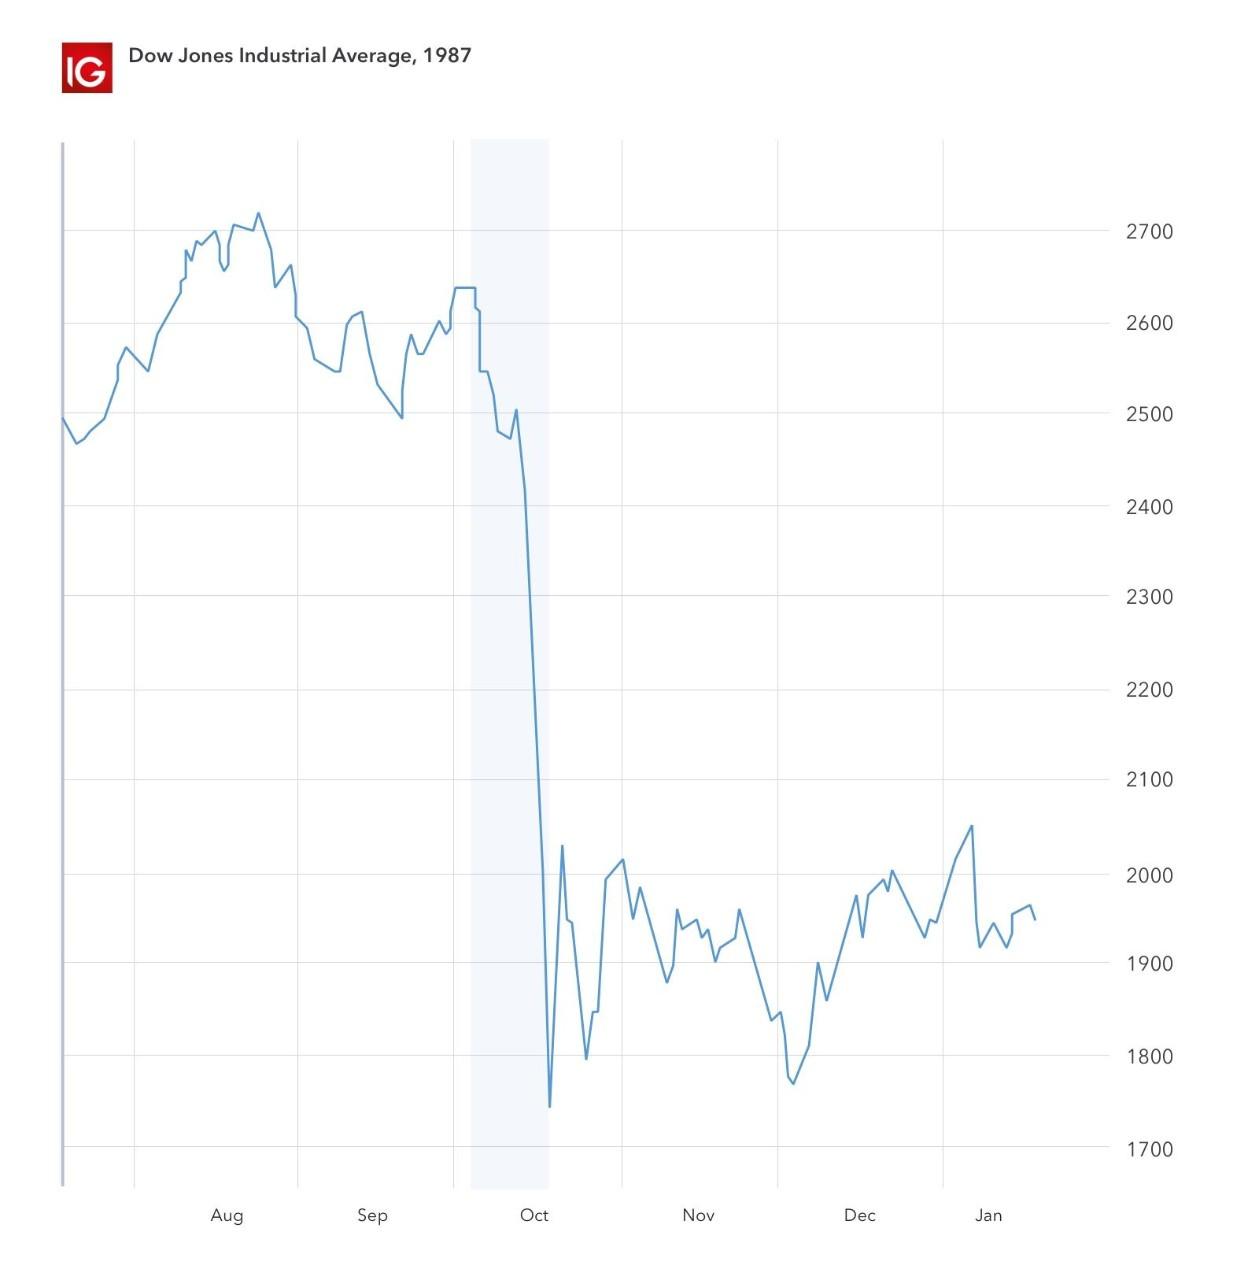
Black Monday: 1987
Black Monday, often referred to as the stock market crash of 1987, impacted stock markets across the world including Hong Kong, London, Berlin and New York. It was considered the single worst trading day since the Wall Street crash.
What happened?
According to some economists, the crisis was brought on by an overvalued dollar, rising interest rates and the formation of a speculative bubble on the stock market. The bulls had been driving the US market since 1982, which had caused the valuations of company shares to climb to excessive levels.
But eventually the financial markets buckled and on Monday 19 October 1987, the Dow Jones stock index lost more than 500 points in just a few hours – a fall of nearly 22%. This sent markets into a bear cycle, which spread across European and the Asian markets.
The crash was also thought to be directly related to the newly automatic trading systems. The concept of large-scale electronic trading was still new, and the capabilities had never faced a test like Black Monday.
Unlike the stock market crisis of 1929, the 1987 crash didn’t have quite the same impact on the US economy, largely due to the role played by the US Federal Reserve (the Fed), which intervened quickly in the market to slash interest rates and manage market liquidity by increasing lending and conducting open-market purchases. US growth was barely affected, and the Dow Jones was able to return to pre-crash levels within two years.
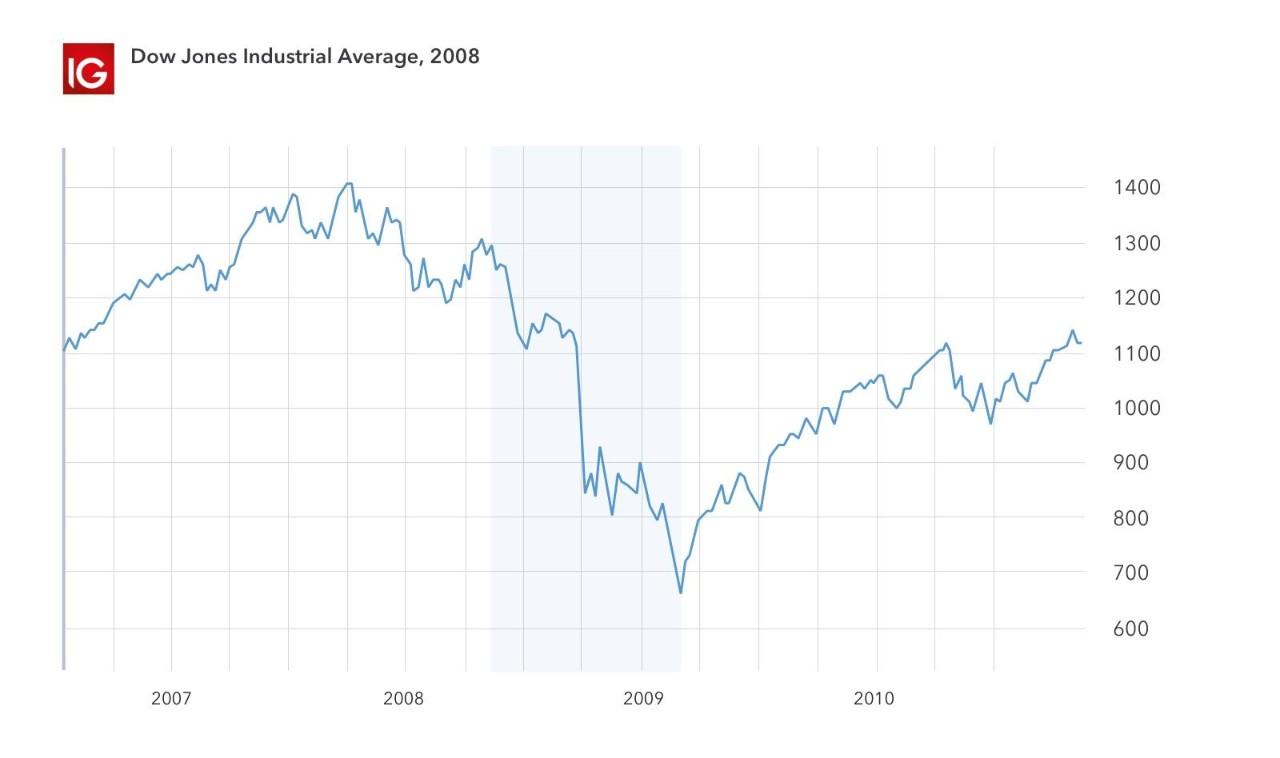
The stock market crash of 2008
The stock market crash of 2008 began in September when the Dow Jones fell 777.68 points in intraday trading. The trigger for the crash was the US Congress rejecting a bank bailout bill, but the causes of the crash had been building throughout the year before, culminating in what we now call the ‘great recession’.
What happened?
During the mid-2000s, the US housing market experienced a boom that reached unprecedented levels, caused by subprime mortgages – a new type of loan granted to individuals with poor credit scores, who would not have been able to apply for conventional mortgages.
But, in 2006, the real estate market collapsed and started a chain reaction which led to the 2008 financial crisis. The banks lost the confidence to loan to each other due to the increased risk that they could receive these mortgage-backed securities as collateral. The lack of lending led to a series of interest rate rises, which hit consumers hard and meant that many new homeowners had to default on their debts.
Things came to a head in September 2008 when Lehman Brothers, the fourth-largest investment bank, announced bankruptcy. The Fed sent a bank bailout bill to Congress, but it was rejected, and the Dow Jones fell by 777.68 points in response. Global markets also panicked, with oil falling from $100 a barrel at the beginning of September 2008 to less than $70 by the end of that month.
Although Congress accepted the bill in October 2008, the damage was done. The Dow Jones had fallen by 13%, and the US economy had contracted by 0.3% – the nation was officially in recession. There was a significant domino effect and, as financial institutions all over the world collapsed, global stock markets plummeted. In March 2009, the Dow Jones bottomed out at around 6594.44 points.
The stock market crash of 2008 has been likened to the events of Black Thursday, as the rates of decline were very similar. It took until 2013 for the stock markets to fully recover.
The flash crash: 2010
On 6 May 2010, the US stock market experienced a flash crash that wiped billions of dollars off the share prices of large US companies like Procter & Gamble and General Electric. The stock market crash started at 2:32pm (New York time) and lasted for approximately 36 minutes – the decline occurred at a speed never seen before but had avery minimal impact on the US economy.

What happened?
As the market opened on 6 May 2010, there were general market concerns over the debt crisis in Greece, as well as a UK general election. Shortly after 3:30pm, the flash crash began, and within ten minutes the Dow Jones had declined by more than 300 points – other US indices were affected, including the S&P 500 and US Tech 100 composite. Within another five minutes, by 3:47pm, the Dow had dropped a further 600 points to reach a loss of nearly 1000 points for the day.
By 4:07pm, the market had regained much of the decline,and only closed 3% lower than it opened. The explanations for the crash range from ‘fat-fingered’ trading – a keyboard error in technical trading – to an illegal cyberattack. Investigations initially pointed the blame toward a single market participant, who was thought to have illegally manipulated the market through ‘spoofing’, which is the practice of deceiving electronic systems into moving in a more favourable direction.
However, it is thought that the causation was multifaceted. A joint report between the US Securities and Exchange Commission (SEC) and the Commodity Futures Trading Commission (CFTC) stated that it was likely a combination of prevailing market conditions, and the large automated sell order that caused the extreme price movement.
The OPEC crash: 2020
The oil price crash of March 2020 saw the biggest fall in oil prices since 1991. The collapse – referred to as the OPEC (Organization of the Petroleum Exporting Countries) crash – was triggered by the price war launched by the world’s top oil exporter, Saudi Arabia.
What happened?
On 5 March 2020, OPEC recommended to intensify production cuts from 2.1 million barrels per day to 3.6 million and prolong these cuts until the end of 2020. The plan was suggested due to the decrease in demand triggered by the global Covid-19 outbreak. However, Russia – also a member of OPEC – refused to agree, stating that it would give the USA an opportunity to fill the gap. This resulted in Saudi Arabia launching an oil price war to fight for a greater market share. By the next day, oil prices were down by almost 9%.
The weekend that followed further demonstrated the effect of the OPEC alliance feud, with oil losing almost a third of its value. Saudi Arabia lowered its official selling price from $8 to $6 and the oil market responded. Brent crude crashed to $33.36 (down by 24%), crude oil prices dropped to $31.13 (down by 26%) and US oil prices tumbled to $27.34 (down by around 34%).
Russia continues to blame the Arab nation for the oil price crash, and its focus has shifted to European markets.
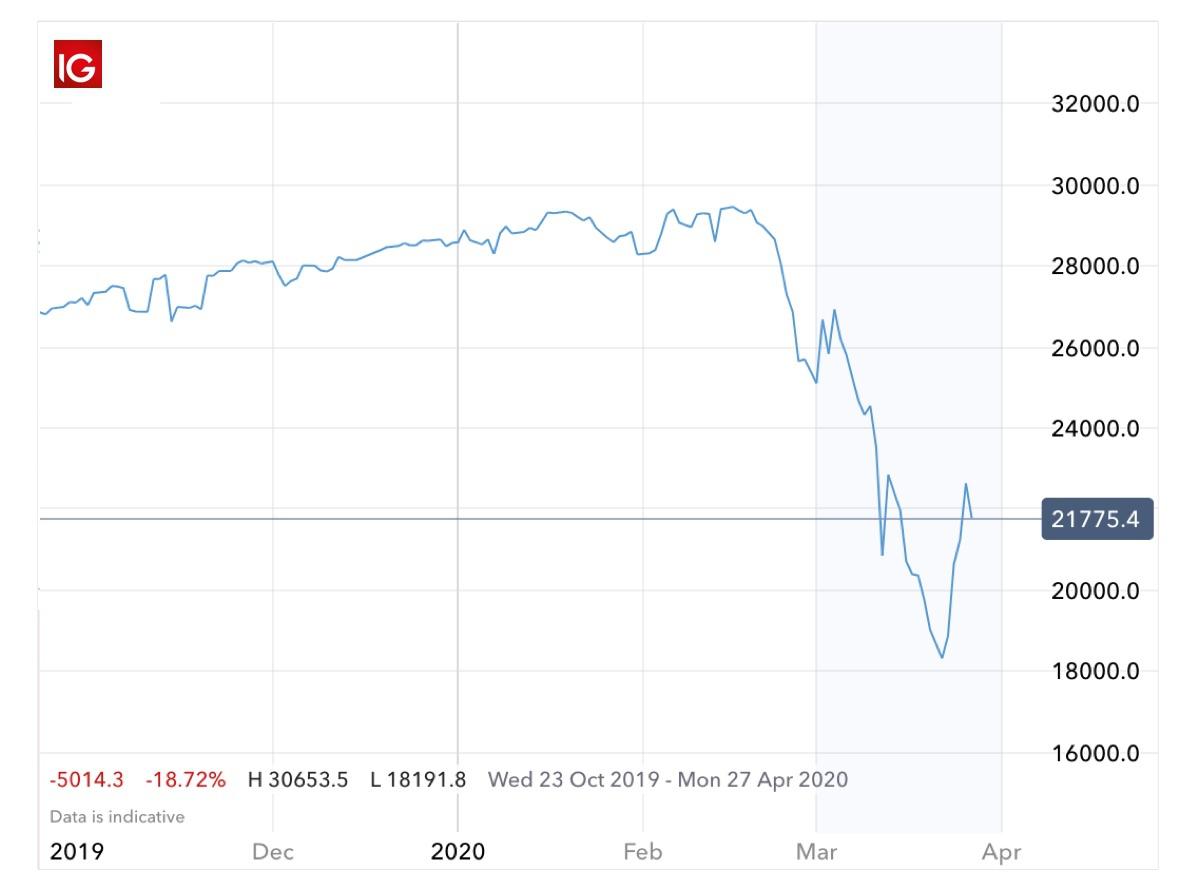
Coronavirus crash: 2020
The Covid-19 outbreak of 2019 started pummeling the markets in early 2020, with indices such as the Dow Jones and FTSE 100 plummeting in the first few months. The biggest impact of the crash was felt in China, but the country’s role in the world economy spread the effects across the globe.
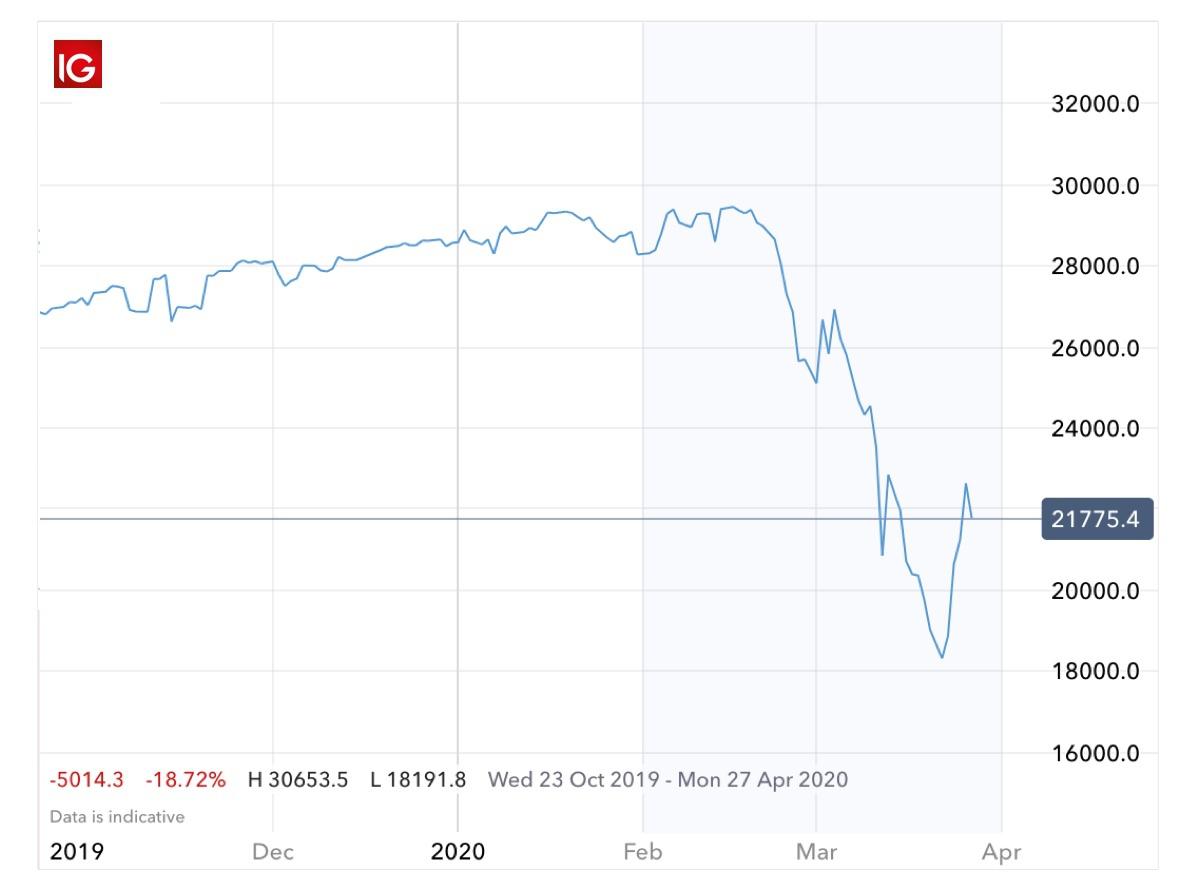
What happened?
In December 2019, China started treating thousands of people for pneumonia caused by an unknown virus. Less than two weeks later, the first related death was reported. The virus – Covid-19 – started to spread globally, infecting hundreds of thousands of people and killing around 2% of patients. Global panic ensued, which had a serious impact on various stock markets.
Travel restrictions were put in place and many businesses were forced to close. Reserve banks started to put measures in place to curb the effects of the crash, and some countries even closed their stock exchanges, but markets continued to fall. By mid-March 2020, Covid-19 had disrupted large parts of the economy, planting fear of another global recession.
The FTSE 100 saw a worse decline that of Black Monday (totaling a loss of £160.4 billion). The US Tech 100 and S&P 500 also reported the sharpest fall since 1987 (9.5% and 9.4% respectively).
The information on this page does not contain a record of our trading prices, or an offer of, or solicitation for, a transaction in any financial instrument. IG Bank S.A. accepts no responsibility for any use that may be made of these comments and for any consequences that result. No representation or warranty is given as to the accuracy or completeness of this information. Consequently any person acting on it does so entirely at their own risk. Any research provided does not have regard to the specific investment objectives, financial situation and needs of any specific person who may receive it and as such is considered to be a marketing communication. Although we are not specifically constrained from dealing ahead of our recommendations we do not seek to take advantage of them before they are provided to our clients. See full non-independent research disclaimer.

Discover how to trade the markets
Explore the range of markets you can trade – and learn how they work – with IG Academy's free ’introducing the financial markets’ course.
