How to pick stocks
Picking the right stocks is essential to any share trader or investor’s success. We’ve put together a complete, step-by-step guide to help you choose the best stocks in your chosen market.


How to pick the best stocks to invest in
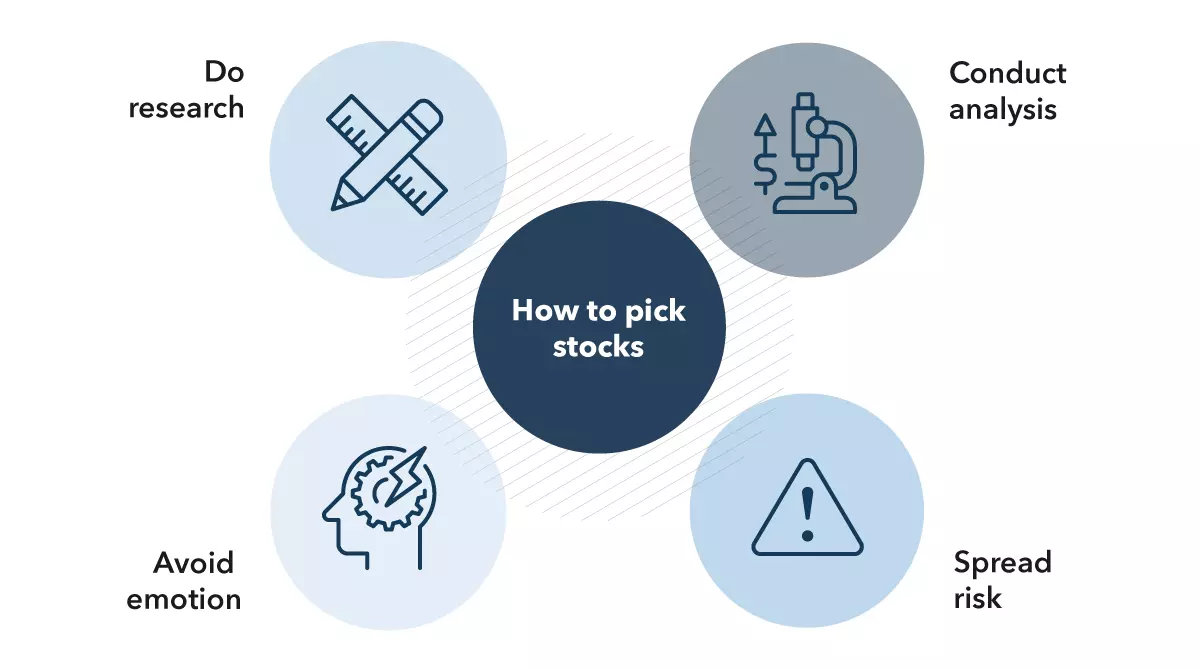
There is no single approach to picking the best stocks to invest in. It depends on a few factors, such as the outcome you’re trying to achieve, your attitude to risk, as well as the time and capital you have available. To pick the best stocks to invest in, you can follow these steps:
- Do your research and understand the business. This includes fundamental and technical analysis to determine the fair value of a stock, as well as understanding the prospects of a business to make sure it’s aligned to your strategy and goals
- Use a mixture of quantitative and qualitative stock analysis to build your portfolio. By doing this you can create an approach that works for you
- Avoid emotion when making investment decisions. Do not simply buy stock because there is hype around it – and do not rush into any buying or selling decisions
- Make sure you spread your risk by diversifying your portfolio
Many investors prefer stocks that pay dividends, because they can be reinvested to increase the size of a holding. The result is that the return on investment is not only based on the capital growth relating to the initial amount deposited, but also on any dividends that are accumulated while the position is open. Others are less concerned with dividends, and like to pick stocks with strong fundamentals, following the value investing style of Warren Buffett.
How to pick stocks using fundamental analysis
There are a few steps to follow if you want to pick stocks using fundamental analysis. Firstly, keep in mind that fundamental analysis centres around estimating a stock’s intrinsic value. This means you should analyse both qualitative and quantitative aspects of the economy, industries within the economy and the individual companies that make up the industry.
Qualitative factors
Qualitative factors to consider include:
Company news
News relating to the company you’re looking to invest in can cause stock prices to rise or tumble. This is because good news often causes individuals to buy stock, while bad news causes them to sell the stock. This affects supply and demand and, ultimately, the share price.
Personnel changes
Personnel changes, including management restructures, are extremely relevant to those looking for stocks, because it affects the market’s perception. The business’s reputation could be affected by any personnel changes, which has a direct impact on stock prices.
Financial events
It’s important to take note of financial events when picking stocks, as these can cause market uncertainty and heightened volatility. Economic events include interest rate decisions, scheduled changes in management, and large-scale events such as Brexit.
Quantitative factors
Quantitative factors include:
Earnings releases
Traders and investors should keep a close eye on changes in company earnings as part of their fundamental analysis. If company earnings drop and the share price does not adjust to the new earnings level, the stock price might not reflect true value.
Balance sheets
A company’s balance sheet will list all its assets and liabilities. A stronger balance sheet generally means a strong stock price, because it reflects earnings potential. As mentioned, earnings also directly affect stock prices.
Dividends
Dividends are a portion of a company’s profit that it chooses to return to its shareholders. They are one of the ways a shareholder can earn money from an investment without having to sell shares. You could use dividends as a deciding factor when choosing stocks, because they indicate that the company is profitable and that there is a good possibility of future earnings.
Ratios
Qualitative factors can be measured by means of various ratios. Fundamental analysis ratios include:
- Price-to-earnings (P/E) ratio, which measures a stock’s value by showing you how much you would have to spend to make $1 in profit. P/E ratio assists in comparing the value of one stock in a sector with another. It can also be used as a guide to determine whether a company is currently overvalued or undervalued compared with its historical averages
- Debt-equity ratio (D/E), which measures a company’s debt against its assets and gives you insight into how the company is performing relative to its competitors. A low ratio could mean that the company gets most of its funding from its shareholders. It’s important to note that a ‘good’ or ‘bad’ ratio depends on the industry
- Return on equity (ROE), which measures a company’s profitability against its equity, expressed as a percentage. It shows you if the company is generating enough income by itself relative to the amount of shareholder investment
- Earnings yield, which measures earnings by dividing the earnings per share (EPS) by the share price. Earnings yield is also a value indicator – the higher the earnings yield, the more likely it is that stocks are undervalued
- Relative dividend yield, which measures a company’s dividend yield compared to that of the entire index. If you’re looking to buy stock, you should consider the relative dividend yield because it can show if stocks are overvalued or undervalued compared to competitor stocks
- Current ratio, which measures a company’s ability to pay off debt. It shows if liabilities can be adequately covered by the available assets. There is a link between this ratio and the stock price. The lower the current ratio, the higher the likelihood that the stock price will continue to go down
- Price-earnings to growth (PEG) ratio, which measures the P/E ratio compared to the percentage growth in annual EPS. If you are deciding on which stocks to pick, you should consider the PEG ratio because it could give you an indication of the stock’s fair value
- Price-to-book (P/B) ratio, which measures the current market price against a company’s book value. A ratio higher than one often indicates overvalued shares
The top-down and bottom-up approach
There are two approaches you can take when conducting fundamental analysis – the top-down and the bottom-up approach. The top-down approach is a faster method, preferred by those who are less experienced or prefer the bigger picture. As part of the top down approach, you may want to analyse economic growth and gross domestic product (GDP), bond prices and yields, monetary policies (including interest rates) and inflation, before choosing a sector and company to focus on.
Bottom-up analysis doesn’t focus on market conditions and industry fundamentals as much as it does on how the company is performing against its competitors. If you prefer this approach, you will consider various financial ratios (mentioned above), revenue and sales, cash flow, management and products.
How to pick stocks using technical analysis
Technical analysis is completely different to fundamental analysis – when picking stocks using technical analysis, you should focus on the stock’s price data and movements. This includes trends and patterns that may indicate the future movements of the market. There are a wide range of technical indicators you can use when conducting technical analysis. Your chosen technical strategy will ultimately depend on your trading style.
- Moving average (MA) is used to identify the direction of a price trend, without the interference of short-term price spikes
- Exponential moving average (EMA) can help confirm significant market moves and gauge their legitimacy
- Stochastic oscillator shows momentum and trend strength by comparing a specific closing price of an asset to a range of its prices over time
- Moving average convergence divergence (MACD) detects changes in momentum by comparing two moving averages. It can help to identify possible buy and sell opportunities around support and resistance levels
- Bollinger bands are used to predict long-term price movements and useful for recognising when an asset is trading outside of its usual levels
- Relative strength index (RSI) is mostly used to help identify momentum, market conditions and warning signals for dangerous price movements
- Fibonacci retracement can pinpoint the degree to which a market will move against its current trend
- Ichimoku cloud identifies support and resistance levels, estimates price momentum and provides you with signals to help with decision-making
- Standard deviation helps you to measure the size of price moves to assist with identifying how likely volatility is to affect the price in the future
- Average directional index illustrates the strength of a price trend to help you gather whether an upward or downward trend is likely to continue
Fundamental vs technical analysis: which is better?
Fundamental and technical analysis are both important when researching potential stock to trade or invest in. One method is not ‘better’ than the other, as there are vast differences between the two. The type of analysis you choose often depends on your strategy. Some long-term traders (position traders or investors) prefer fundamental analysis, while traders with a short-term strategy tend to focus on technical analysis. It is important to look at both forms of analysis, to ensure you do not miss any important information.
What makes a stock valuable?
A stock’s value is measured by the relationship between supply and demand. A high demand generally means a higher price, and vice versa. Further to this, a stock’s value is intrinsic to the return it can offer to a trader or investor. Some investors pick companies with strong fundamentals, whereas others choose smaller, under-appreciated companies with the potential to grow quickly. There are different valuation methods you can use to determine if stocks are undervalued or overvalued.
How to identify undervalued and overvalued stocks
If you want to identify undervalued or overvalued stocks, you should start with fundamental and technical analysis. You can use the eight popular ratios that form part of fundamental analysis to find undervalued or overvalued stocks and determine their true value. However, you should use both fundamental and technical analysis to get the most complete picture of the market.
Finding undervalued or overvalued stocks is not about finding cheap or expensive stocks. Instead, you should look for quality stocks that are priced below or above their fair values. The assumption is that market prices will correct over time to reflect true value, which means you could make a profit. You would do this by going long on an undervalued stock, or short on an overvalued one (see how to take a position on stocks).
Stocks may be undervalued or overvalued if there are changes to market conditions due to market dynamics, news, cyclical fluctuations or misjudged results.
Learn more about how to identify overvalued stocks
How to take a position on stocks
With IG Bank you can take a position on stocks by trading derivatives.
If you want to speculate on upward or downward price movements, you can do so via CFD trading. With CFDs, you don’t need the full value of the stock upfront, because you’ll trade using leverage. And, because you don’t own the stock, you can go long or short.
It only takes a few minutes to create your account and you can top up your trading funds using a credit card or via bank transfer.
If you would rather take some time to practise your trades without risking real money, you can open a demo account, which gives you CHF 20,000 in virtual funds.
What to bear in mind when choosing stocks
Create a trading plan
Drafting a comprehensive trading plan and risk management strategy starts with writing down your goals. These goals should be specific, measurable, attainable, relevant and time-bound.
Find out how to create a successful trading plan
Your trading plan should be customised to your goals and outline the exact rules to follow when trading. Start by deciding on your trading style. There are four different styles, each with a different time frame, holding period and level of trading activity. The trading style you choose should suit your personality, skills and experience. The four different trading styles are:
- Position trading: buy and hold (investing) or long-term trading with low trading activity
- Swing trading: medium-term trading with average trading activity. Read more about the best strategies for swing trading
- Day trading: short-term trading with high trading activity. Learn more about picking stocks for day trading
- Scalping: very short-term trading with very high trading activity

Understand the market
Stocks are listed on a stock exchange, which facilitates the buying and selling of shares between parties. The stock market is moved by supply and demand. The general state of the economy, interest rates, industry trends and market sentiment also play a role in stock market changes.
Use a market screener
You can use the IG Bank market screener to look for stocks. The screener makes it easy to compare stocks against each other. This way, you can choose the stocks that best suit your risk profile.
Remember, you should pick stocks that you know a lot about. Consider all things – including volatility, exchange opening hours, and the cost.
Manage your risk
When picking stocks, it’s important to make sure they suit your risk management strategy. All markets carry some degree of risk, because stocks are continuously affected by external factors, which means the trade will not always perform as expected.
Some of the risks you may face when picking stocks include obsolete business models, poor decisions by management and new competitors. Then there’s also general market risk and exchange rate risk – especially important to consider if you’re investing in overseas stocks. IG Bank offers different hedging opportunities to help you hedge against these risks.
How much trading risk you’ll take on depends on your strategy, the exposure you are taking on in relation to your wider portfolio, and the risk-reward ratio you’ve set for yourself. Therefore, it’s important to decide how much capital you’re willing to risk per trade and overall.
Choosing stocks summed up
- To pick the best stocks to invest in, consider factors such as the outcome you’re trying to achieve, your attitude to risk, as well as the time and capital you have available
- You should use fundamental and technical analysis to pick stocks
- Fundamental analysis centres around estimating a stock’s intrinsic value
- Technical analysis looks at trends and patterns that may indicate the future movements of the market
- A stock’s value is measured by the relationship between supply and demand. Technical and fundamental analysis can help you to determine if stocks are overvalued or undervalued
- When choosing stocks, bear in mind that you need a trading plan and a good understanding of the stock market
- You can open an IG Bank trading account to start trading stocks using CFDs
The information on this page does not contain a record of our trading prices, or an offer of, or solicitation for, a transaction in any financial instrument. IG Bank S.A. accepts no responsibility for any use that may be made of these comments and for any consequences that result. No representation or warranty is given as to the accuracy or completeness of this information. Consequently any person acting on it does so entirely at their own risk. Any research provided does not have regard to the specific investment objectives, financial situation and needs of any specific person who may receive it and as such is considered to be a marketing communication. Although we are not specifically constrained from dealing ahead of our recommendations we do not seek to take advantage of them before they are provided to our clients. See full non-independent research disclaimer.

Explore the markets with our free course
Learn how shares work – and discover the wide range of markets you can trade CDFs on – with IG Academy's free ’introducing the financial markets’ course.
Put learning into action
Try out what you’ve learned in this shares strategy article risk-free in your demo account.
Ready to trade shares?
Put the lessons in this article to use in a live account – upgrading is quick and easy.
- Trade over 12 000 popular global stocks
- Protect your capital with risk management tools
- React to breaking news with out-of-hours trading on 70 key US stocks
Inspired to trade?
Put your new knowledge into practice. Log in to your account now.
