Nasdaq 100: Can the Alphabet share price catch up with its peers?
Despite cost reductions and cutting edge innovation Alphabet’s share price lags behind.


Nasdaq 100: Can the Alphabet share price catch up with its peers?
Despite cost reductions and cutting edge innovation Alphabet Inc - C (24 Hours)’s share price lags behind that of its competitors and this situation is unlikely to change anytime soon.
Despite cost reductions and cutting edge innovation Alphabet’s share price lags behind
Alphabet’s share price, although having performed extremely well this year and having risen by over 33% year-to-date, is lagging its mega cap tech competitors such as Amazon, Apple, Meta and Netflix by a wide margin.
Google finance Alphabet comparison chart
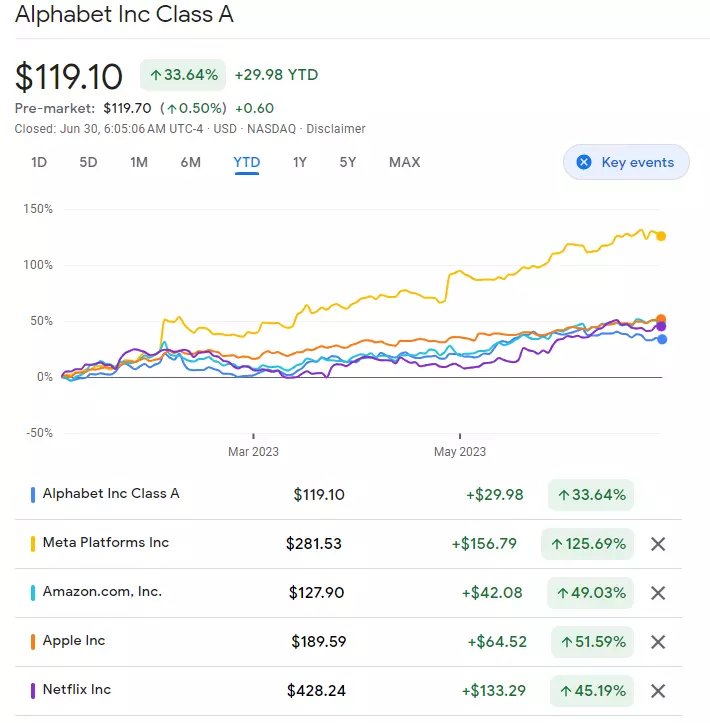
Even though Alphabet is launching a generative AI-driven chatbot for travel planning while YouTube is conducting internal testing of a new Alphabet gaming product called Playables, the Alphabet share price has recently been slipping while that of its competitors continues to rise.
Alphabet’s cost cutting through redundancies at mapping app Waze as it merges with its own map products hasn’t helped the company’s share price either.
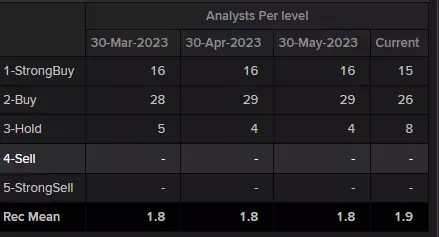
What do analysts think?
According to Refinitiv Eikon Alphabet analysts rate the share a “buy” with a median long-term price target at $130.00, approximately $10 or 8% above current prices (as of 30/06/2023).
Technical analysis:
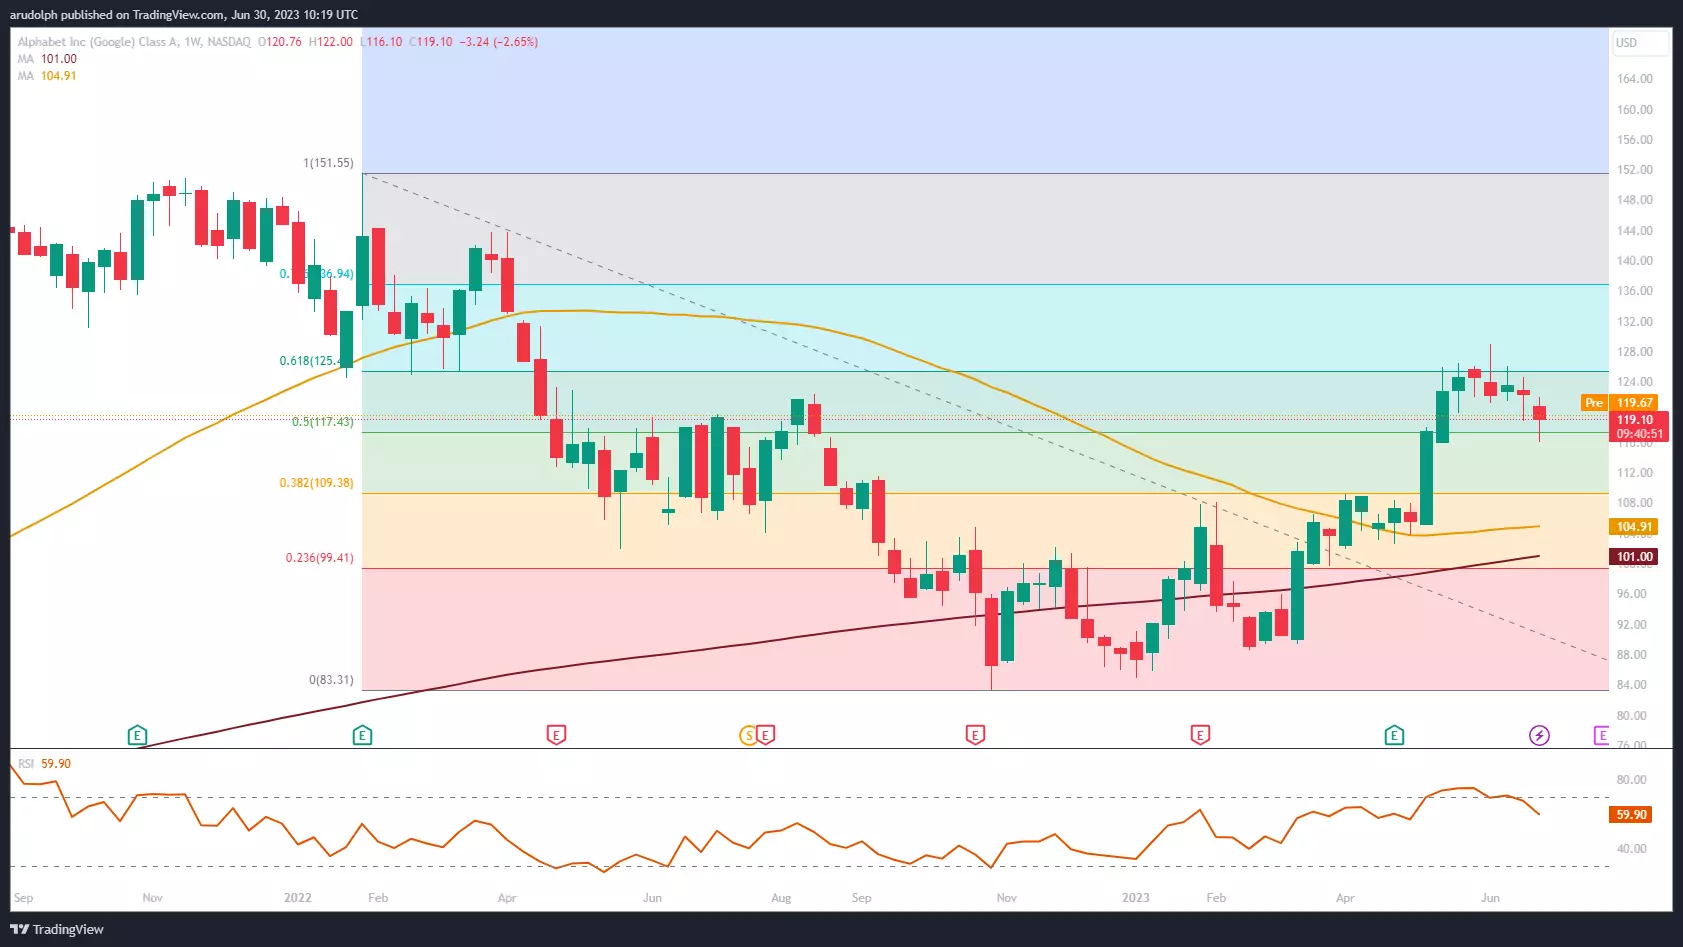
Although Alphabet's presence and innovations in the tech industry continue to make headlines this is not reflected in its share price which actually fell in June.
The Alphabet share price October-to-June advance stalled around the 61.8% Fibonacci retracement of the 2022 bear market at $129.04 in early June and has been coming off since.
Alphabet Weekly Candlestick Chart
Reasons to be careful
Since the Nasdaq 100 Bullish Percent Index has given a sell signal last week at a time where the CNN Greed and Fear Index has stayed in “extreme greed” territory for the third week in a row and as the Chicago Board of Options Exchange (CBOE) volatility index (VIX) continues to slide and trades at pre-pandemic levels, the risks of Nasdaq 100 stocks such as Alphabet slipping further during July seem to be increasing by the day.
All of these contrary indicators show how complacent investors are when it comes to adding to their long US stock positions or entering new ones at current levels. In past situations like these, a sudden bearish reversal did more often than not take place, especially during the summer months (in the Northern hemisphere). It is when trading volumes tend to decrease as people take their eyes off the markets and go on holiday.
Alphabet Daily Candlestick Chart
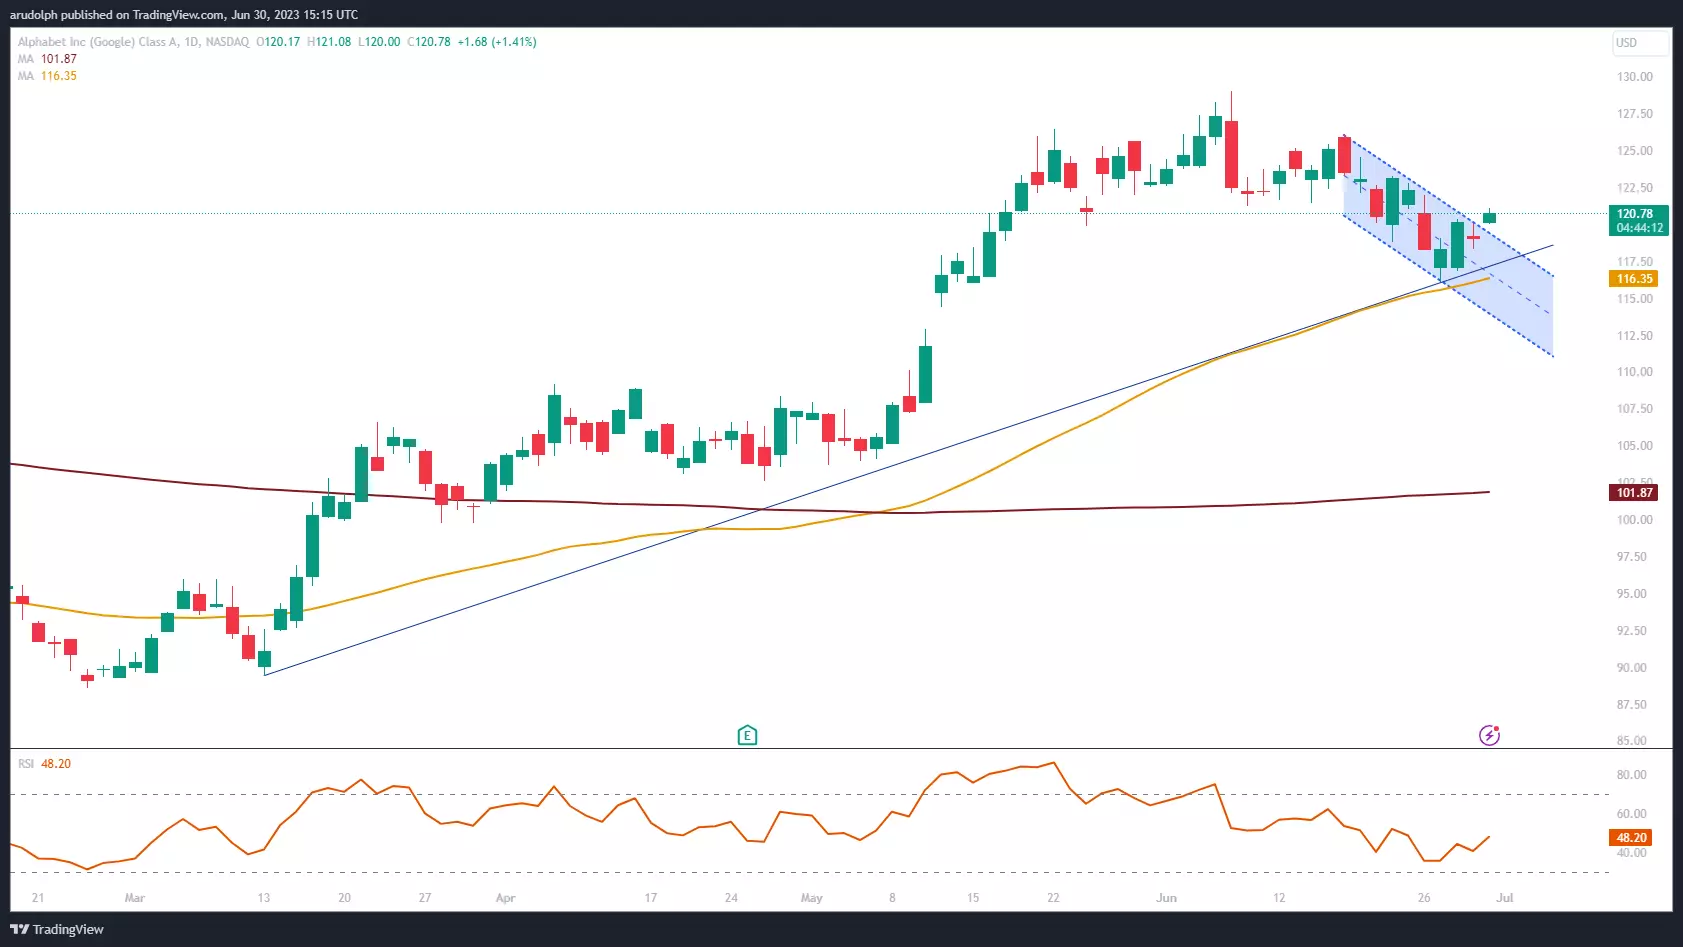
The Alphabet share price may thus slide back to the February and April highs at $109.17 to $108.18 over the summer months before perhaps resuming its ascent to above its early June high at $129.04 in the third quarter of 2023.
The question is whether the anticipated decline will actually take place and, if it does, whether it'll be as pronounced as that of its peers.
This information has been prepared by IG, a trading name of IG Australia Pty Ltd. In addition to the disclaimer below, the material on this page does not contain a record of our trading prices, or an offer of, or solicitation for, a transaction in any financial instrument. IG accepts no responsibility for any use that may be made of these comments and for any consequences that result. No representation or warranty is given as to the accuracy or completeness of this information. Consequently any person acting on it does so entirely at their own risk. Any research provided does not have regard to the specific investment objectives, financial situation and needs of any specific person who may receive it. It has not been prepared in accordance with legal requirements designed to promote the independence of investment research and as such is considered to be a marketing communication. Although we are not specifically constrained from dealing ahead of our recommendations we do not seek to take advantage of them before they are provided to our clients.

Seize a share opportunity today
Go long or short on thousands of international stocks.
- Increase your market exposure with leverage
- Get commission from just 0.08% on major global shares
- Trade CFDs straight into order books with direct market access
Live prices on most popular markets
- Forex
- Shares
- Indices