Kiwi and Aussi dollar slip on cautious RBNZ while USD/JPY remains bid
Outlook on AUD/USD, NZD/USD and USD/JPY amid less hawkish RBNZ.


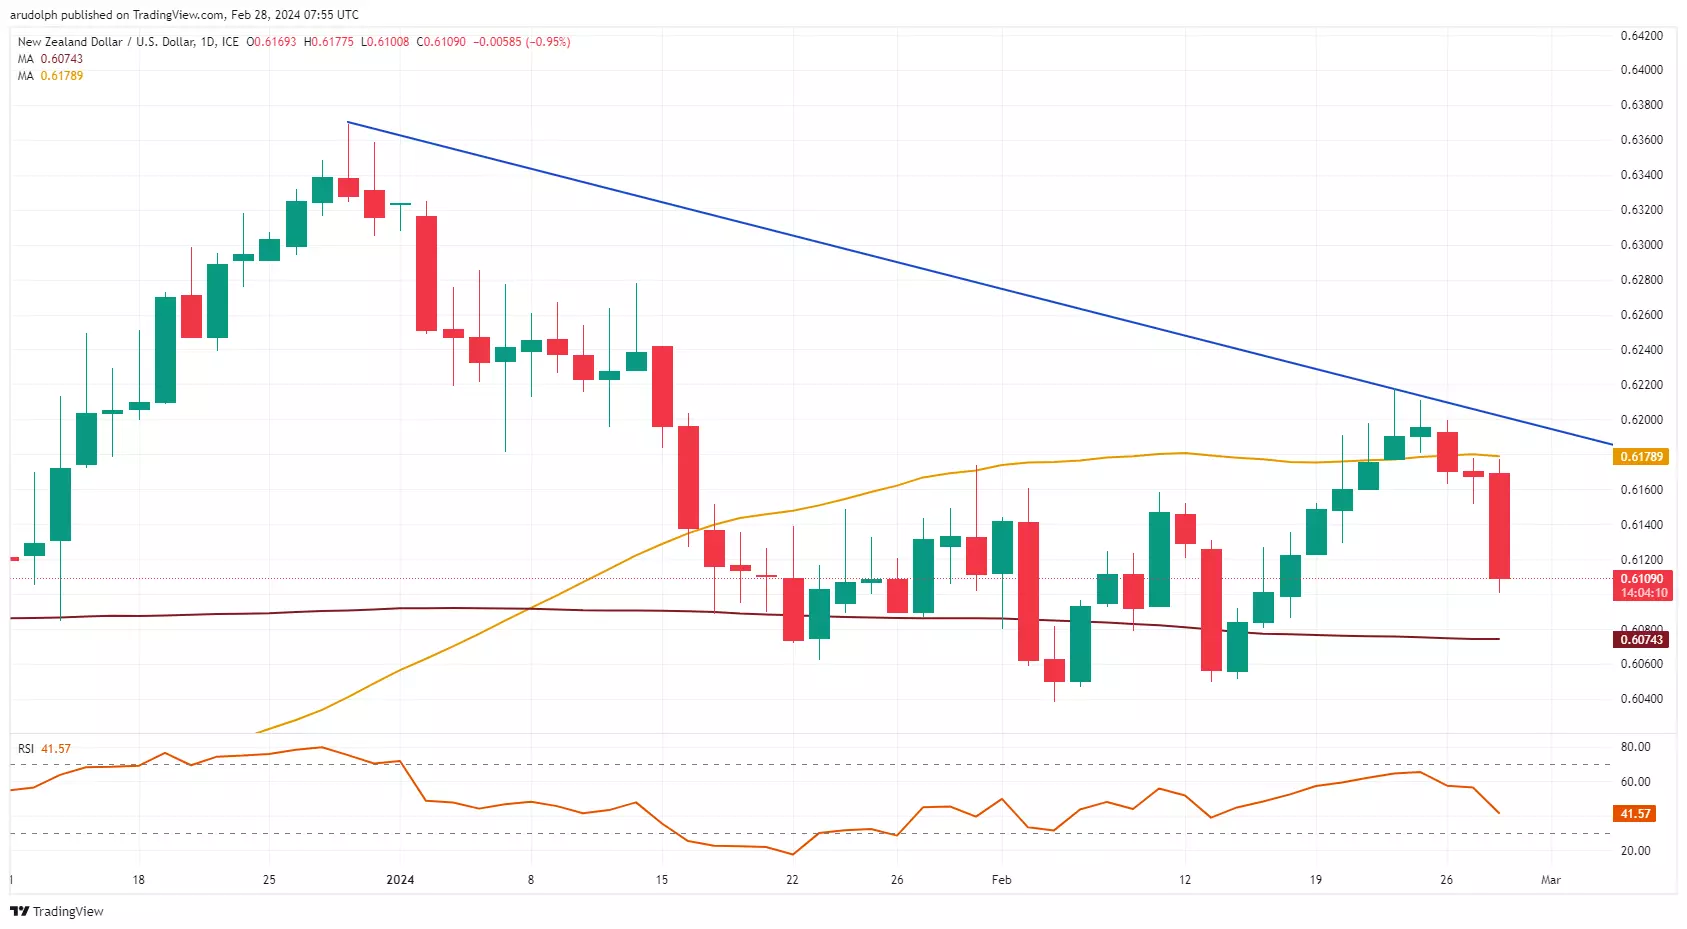
NZD/USD has taken a hit on cautious RBNZ
The Kiwi dollar NZD/USD dropped like a stone as New Zealand's central bank signaled a slightly less aggressive stance on rate hikes with the 200-day simple moving average (SMA) at $0.6074 representing a possible downside target.
Below it lies a major support zone at $0.6063 to $0.6039 which consists of the January and current February lows and may once again support the cross. Minor resistance sits at the 9 February high at $0.6158.
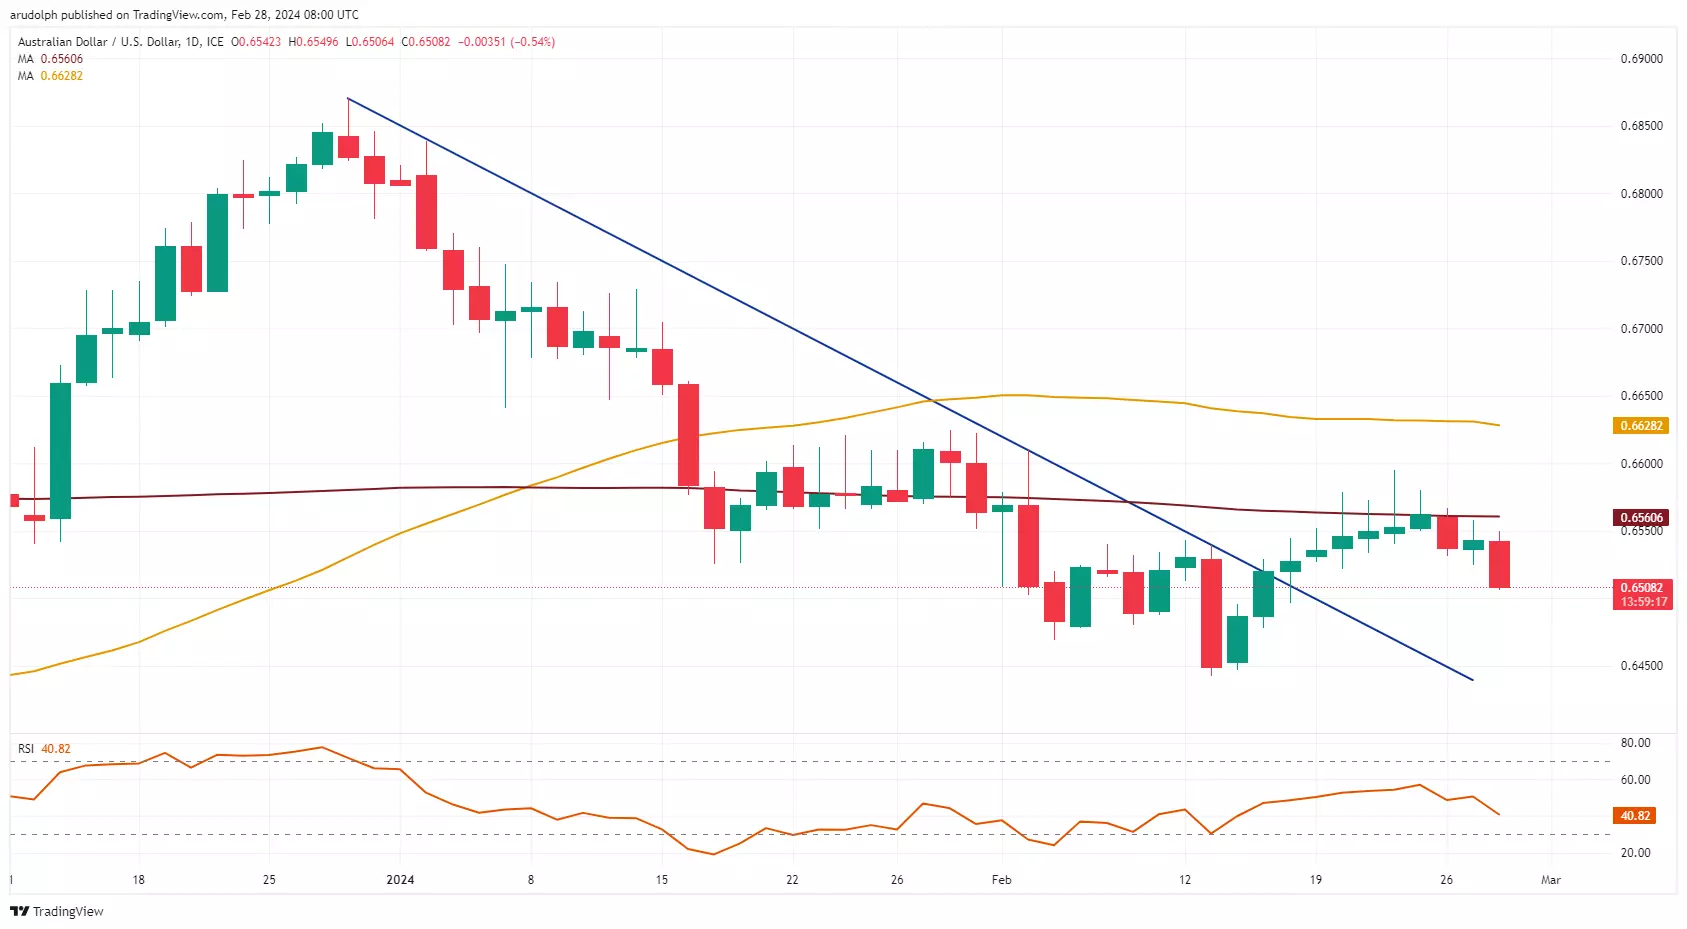
AUD/USD's retracement lower gains traction
AUD/USD drop through the 200-day SMA at $0.6561 is taking it towards its mid-February low at $0.6495. As long as this level doesn't give way, the mid-February advance remains intact.
The $0.6610 to $0.6631 late January to early February highs and 55-day SMA aren't expected to be reached in the next few days, though.
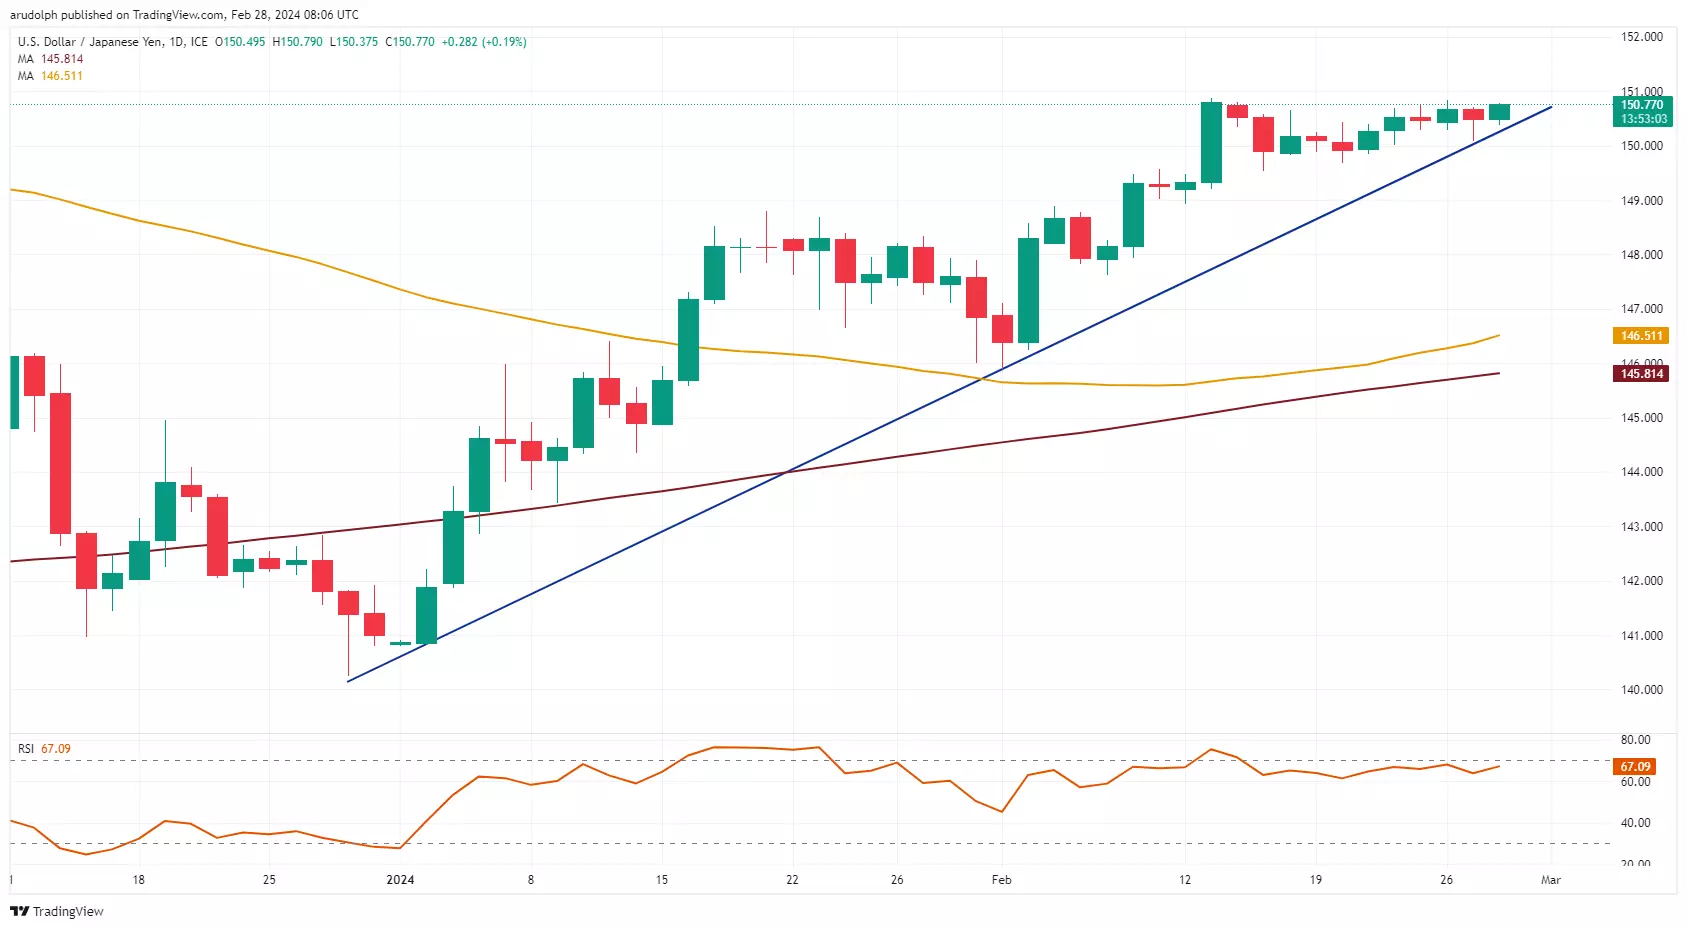
USD/JPY stays bullish while above ¥149.54
USD/JPY still trades in low volatility above the minor psychological ¥150.00 mark which it revisited on Tuesday. The four-month high at ¥150.88 remains in view. Above it the October-to-November record highs can be spotted at ¥150.91-94.
Only if the mid-February ¥149.54 low were to be fallen through, would the ¥148.89-80 support zone be back in the frame.
This information has been prepared by IG, a trading name of IG Australia Pty Ltd. In addition to the disclaimer below, the material on this page does not contain a record of our trading prices, or an offer of, or solicitation for, a transaction in any financial instrument. IG accepts no responsibility for any use that may be made of these comments and for any consequences that result. No representation or warranty is given as to the accuracy or completeness of this information. Consequently any person acting on it does so entirely at their own risk. Any research provided does not have regard to the specific investment objectives, financial situation and needs of any specific person who may receive it. It has not been prepared in accordance with legal requirements designed to promote the independence of investment research and as such is considered to be a marketing communication. Although we are not specifically constrained from dealing ahead of our recommendations we do not seek to take advantage of them before they are provided to our clients.

Start trading forex today
Trade the largest and most volatile financial market in the world.
- Spreads start at just 0.6 points on EUR/USD
- Analyse market movements with our essential selection of charts
- Speculate from a range of platforms, including on mobile
Live prices on most popular markets
- Forex
- Shares
- Indices