The basics of technical analysis
Choosing your analysis tools
Now that we've explored some of the key tools and techniques frequently used by technical analysts, let's finish by considering how you should go about choosing which ones to use in your own trading.
Which moving averages should I use?
As we saw in the last section, using several moving averages at once can provide all manner of trading signals, so it's important you chose the right ones to suit the situation and your trading style. Remember that shorter-period (faster) moving averages stick closer the price, so you're more likely to catch trends or reversals early - though, you're also more likely to get caught out by false signals and fakeouts.
Similarly, EMAs give more weight to recent price movements than MAs, so tend to react more quickly to price moves - though are also more vulnerable to short-term price spikes.
The best way to trade with moving averages is to experiment yourself with different speeds and find the ones that work for you, based on the type of signals you're looking for and whether you're trading over the short or long term. However, it's sensible to start off by looking at the most popular periods, because the more traders that are using these levels, the more likely they are to become self-fulfilling.
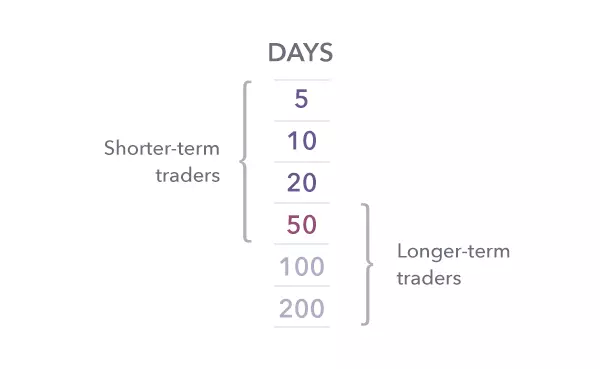
For example, if enough traders believe an asset's 50-day simple moving average will turn out to be a strong resistance level - and decide to sell when the market reaches it - then the price will indeed be forced down because of that selling pressure.
The most popular moving average periods are:
Putting it all together
In this basic introduction to technical analysis we've gone through a fair number of chart patterns, candlestick patterns and looked at one technical indicator in depth. Even with this limited knowledge of the subject, you can start finding a large number of trading signals on pretty much any chart you care to look at. And yet this is barely scratching the surface of the number of techniques and indicators available. So how do you select the best ones to use?
As we touched on earlier, no indicator, pattern or technique is right all the time. False signals are thrown up constantly - so the best way to use technical analysis is to try and identify when you can trust a signal, and when (and why) false signals appear. You can do this by studying how the market tends to react in different situations, and by combining techniques like trend analysis with moving averages, chart patterns and other indicators.
The more techniques you know, the more you can draw on to help inform your trading strategies - though it's by no means necessary to know how to use every major indicator out there. It's really all down to you and how you like to trade. Some traders only use support and resistance levels for example, while others combine a large number of complex indicators.
The only true way to learn is to try it out for yourself and see what works for you - though we'd recommend practising these techniques on a demo platform first.
Lesson summary
- MAs and EMAs can be useful on their own, but they can be even more powerful when combined with each other, or with other technical analysis techniques
- Remember that no technical indicator, pattern or technique will be accurate all the time - be wary of false signals
- Rather than trying to master every available technical indicator, take your time exploring ways of using different analysis tools to find what works for you
-
1
Introduction to technical analysis
3 min -
2
Types of charts
6 min -
3
Support and resistance
4 min -
4
Breakouts and fakeouts
4 min -
5
Trends and channels
4 min -
6
Basic chart patterns: part one
5 min -
7
Basic chart patterns: part two
6 min -
8
Candlestick patterns
7 min -
9
Moving averages
5 min -
10
Using moving averages
6 min -
11
Choosing your analysis tools
5 min -
Quiz
10 questions