The basics of technical analysis
Using moving averages
So now that we've explored the mechanics of moving averages, you may be wondering how you can apply that information in your trading. In this section we'll take a look at some ways of interpreting moving averages and forecasting market behaviour.
Deriving trend direction using moving averages
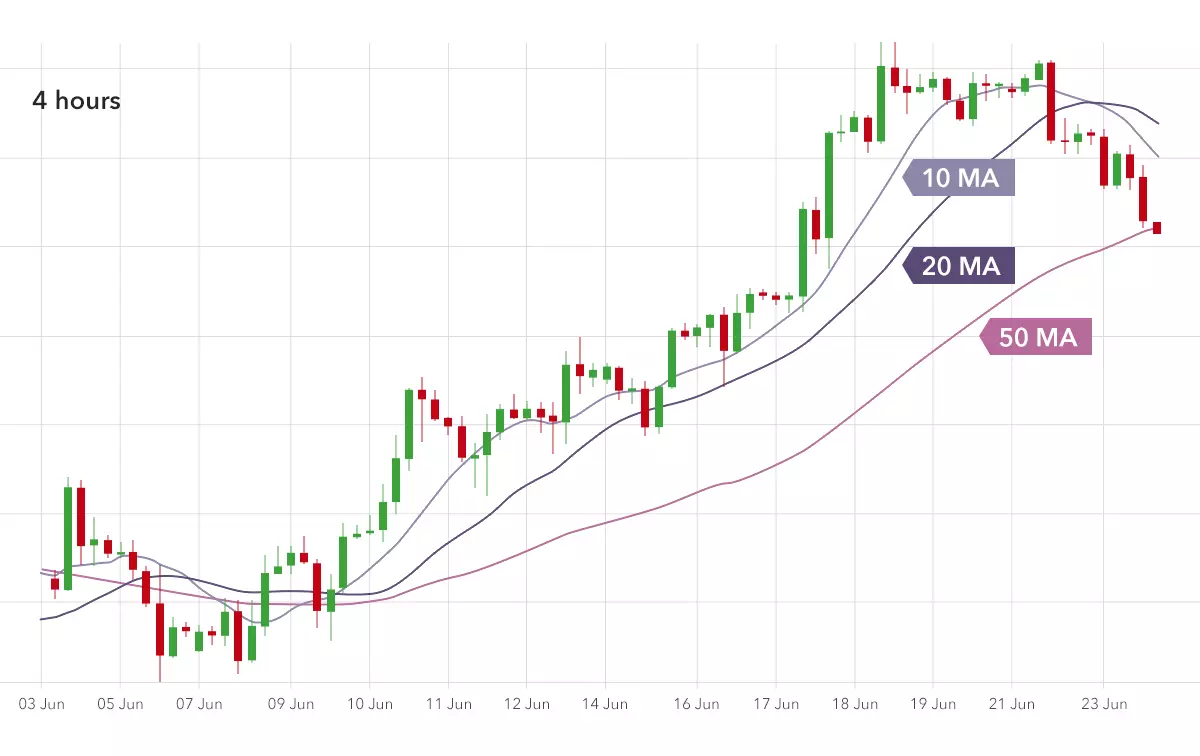
Generally, in an uptrend, the shorter-period or faster moving averages will remain above the longer-period or slower ones. You'd expect that because the slower moving averages will take longer to react to the trend. In this four-hour GBP/USD chart, for example, during the uptrend the 10 MA is at the top, followed by the 20 MA then the 50 MA.
In downtrends the reverse is generally true, as shown in this daily EUR/USD chart, where the 50 EMA is at the top, followed by the 20 EMA and 10 EMA:
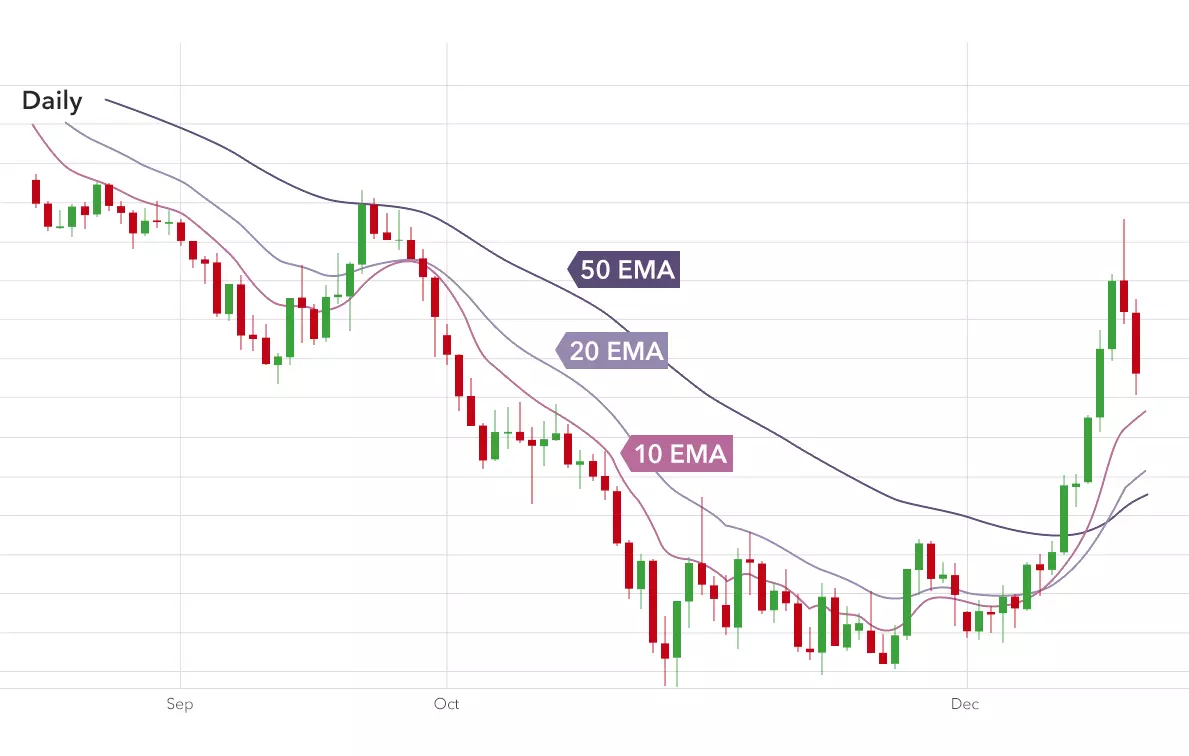
Notice how the 20 EMA and 10 EMA touch in the middle of the trend, so this method - like all technical analysis - is not foolproof. However, when combined with other techniques such as trend lines and channels, it can be a useful way of identifying the general direction a market is headed.
Moving average crossovers
Let's go back to the four-hour GBP/USD chart, but this time removing the 50 MA:
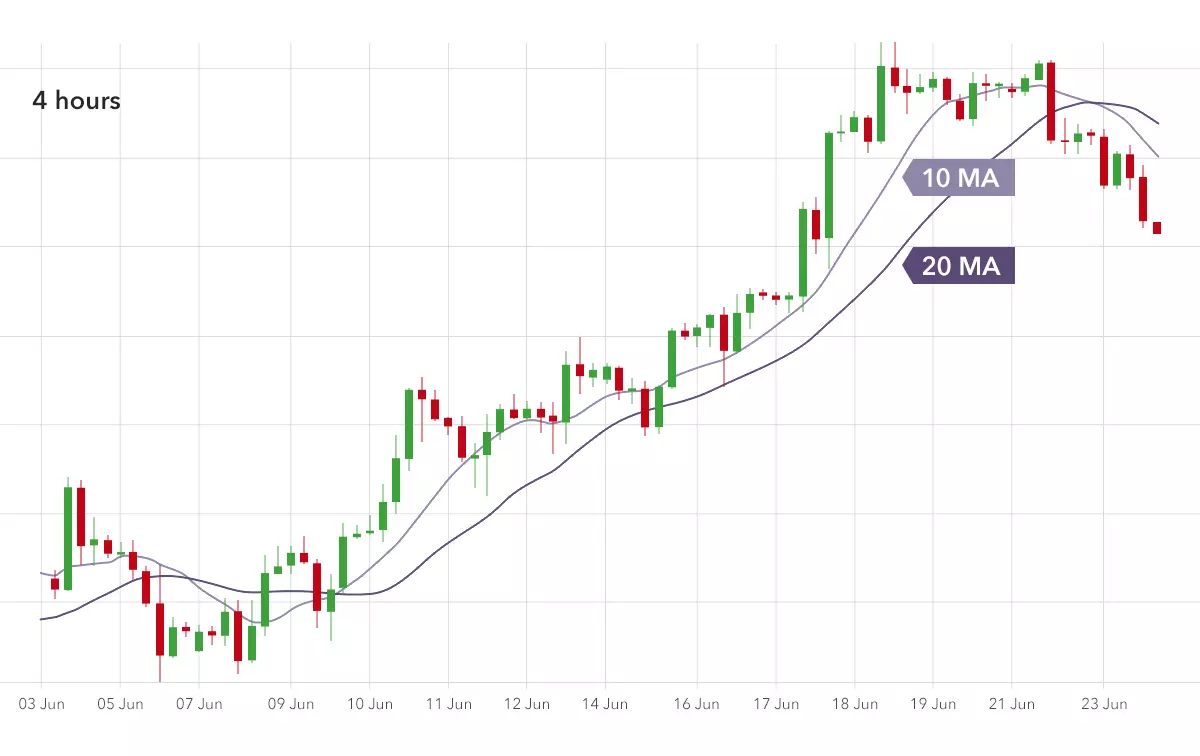
As we've seen, the 10 MA is usually above the 20 MA in an uptrend, but below it in a downtrend. The points where the moving averages cross therefore, can be useful places to enter and/or exit trades. In general, you would go long when the shorter term MA crossed above the longer term MA and reverse your position when the longer term MA crosses above the shorter term MA.
If you were to follow this strategy for the uptrend above, you would've gone long on 9 June when the MAs crossed, then exited the trade on 21 June when they crossed again - in this case making a healthy profit.
Note that this method should only be used when the market is in a strong uptrend or downtrend. If the market is consolidating or trending sideways, it's likely you will be hit with a large number of crossover signals which are unlikely to be profitable.
Using moving averages as support and resistance
Just like trend lines or channels, moving averages can be used as dynamic support and resistance levels, with the added benefit you don't have to draw them yourself. Let's have a look at the daily EUR/USD chart again with just the 10 EMA added this time.
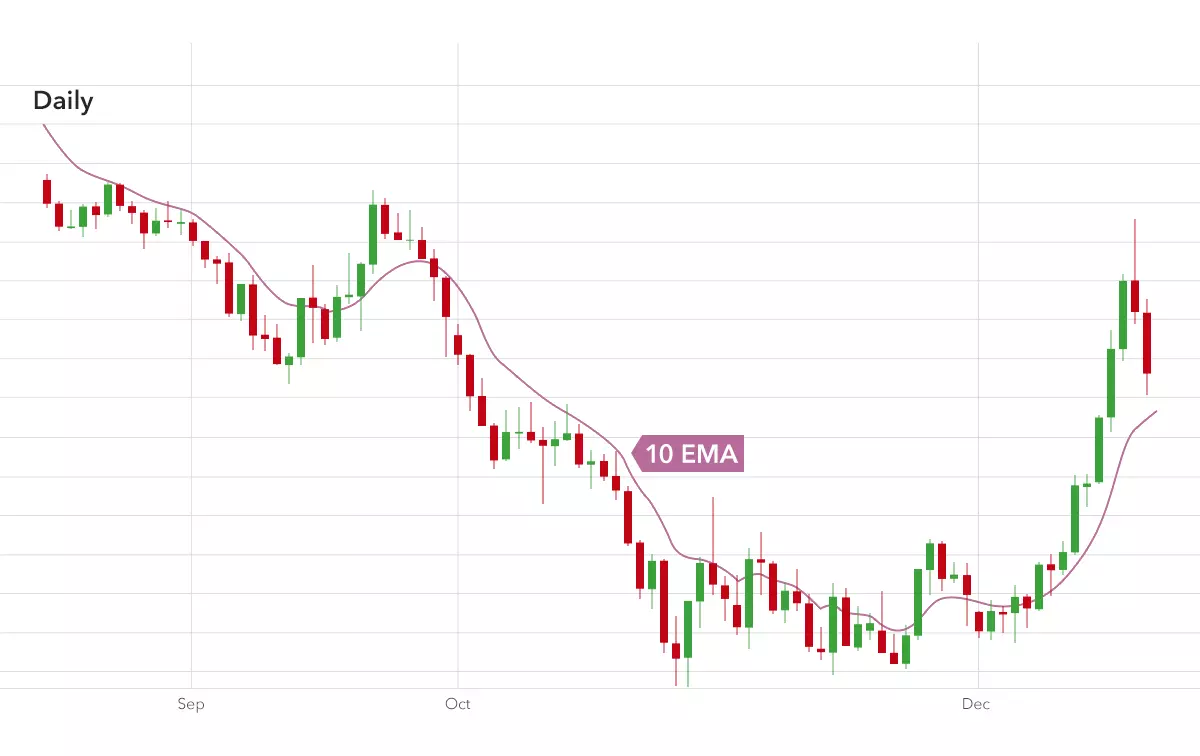
As you can see the 10 EMA resistance level held for most of the downtrend. However, there was a point in mid-September where the price broke quite significantly above the line. This turned out to be a fakeout as the downtrend continued towards the end of the month and into October.
It's for this reason that many traders add more than one moving average to a chart. If we include the 50 EMA as well, we can see that - although the 10 MA level was broken - the 50 MA level held during that brief rally in September.
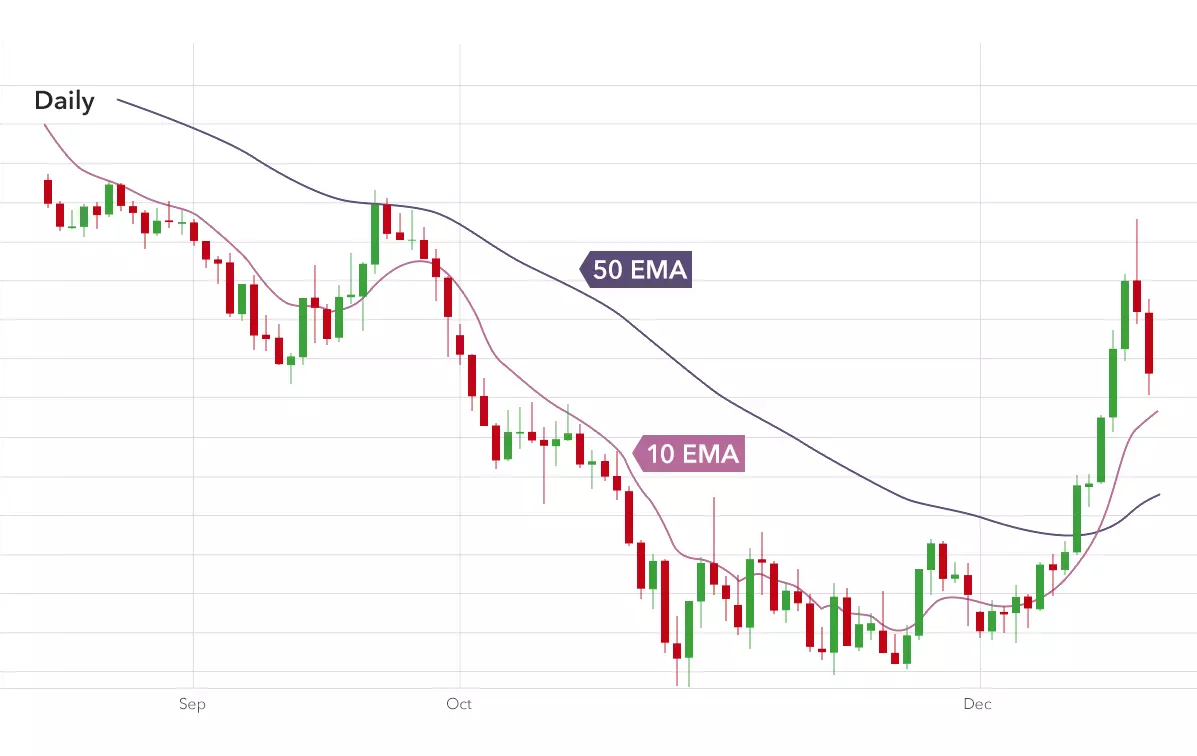
Adding the 50 EMA also throws up a strong crossover signal at the end of a period of consolidation in November and early December, just before the market goes into an uptrend.
In the next section, we'll go on to discuss the importance of combining a selection of moving averages and other technical analysis tools to improve the accuracy of your analysis.
Lesson summary
- In an uptrend, faster moving averages tend to stay above the slower ones. In a downtrend the reverse is true
- Crossovers can be important signals to trade
- Moving averages can also be used as dynamic support and resistance levels
-
1
Introduction to technical analysis
3 min -
2
Types of charts
6 min -
3
Support and resistance
4 min -
4
Breakouts and fakeouts
4 min -
5
Trends and channels
4 min -
6
Basic chart patterns: part one
5 min -
7
Basic chart patterns: part two
6 min -
8
Candlestick patterns
7 min -
9
Moving averages
5 min -
10
Using moving averages
6 min -
11
Choosing your analysis tools
5 min -
Quiz
10 questions
The risks of loss from investing in CFDs can be substantial and the value of your investments may fluctuate. 69% of retail client accounts lose money when trading CFDs, with this investment provider. CFDs are complex instruments and come with a high risk of losing money rapidly due to leverage. You should consider whether you understand how this product works, and whether you can afford to take the high risk of losing your money.
CFD Accounts provided by IG International Limited. IG International Limited is licenced to conduct investment business and digital asset business by the Bermuda Monetary Authority.
IG provides an execution-only service. The information in this site does not contain (and should not be construed as containing) investment advice or an investment recommendation, or an offer of or solicitation for transaction in any financial instrument. IG accepts no responsibility for any use that may be made of these comments and for any consequences that result.
The information on this site is not directed at residents of the United States and is not intended for distribution to, or use by, any person in any country or jurisdiction where such distribution or use would be contrary to local law or regulation.
IG International Limited is part of the IG Group and its ultimate parent company is IG Group Holdings Plc. IG International Limited receives services from other members of the IG Group including IG Markets Limited.
©2003-2026
