The basics of technical analysis
Basic chart patterns: part two
In this section we'll look at four more patterns that are commonly identified by technical analysts.
Triangles
These occur when a market price starts to converge towards a single point. How the triangle is formed can give an indication as to where the price will move next. There are three main types:
An ascending triangle forms as the market hits a strong level of horizontal resistance, but a series of higher troughs indicate that the price is converging towards it. This pattern usually signals that the price will move higher, but bear in mind the resistance level might be too strong, causing the price to bounce off. Generally, a sensible way to trade triangles is to wait until the pattern has formed, and then trade the breakout.
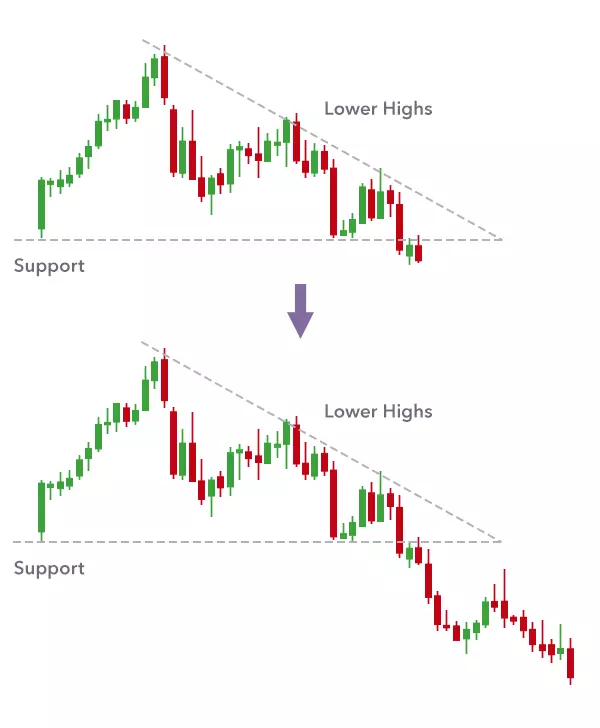
A descending triangle works in the opposite way to an ascending triangle. The market hits a level of support, but a series of successively lower peaks suggests the price will move lower.
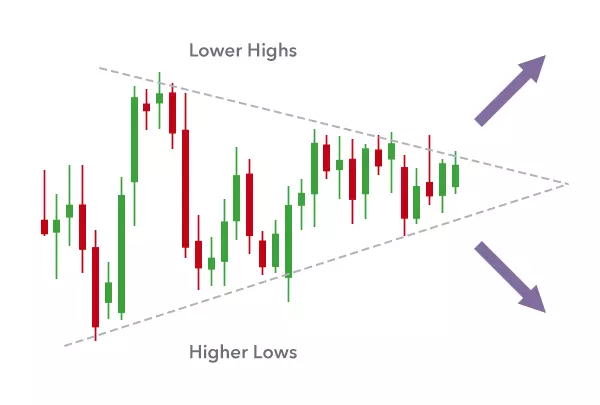
A symmetrical triangle occurs when the price appears to be converging with a series of lower peaks and higher troughs. This is a continuation pattern, which means that the market will usually continue in the same direction as the overall trend after the pattern has formed.
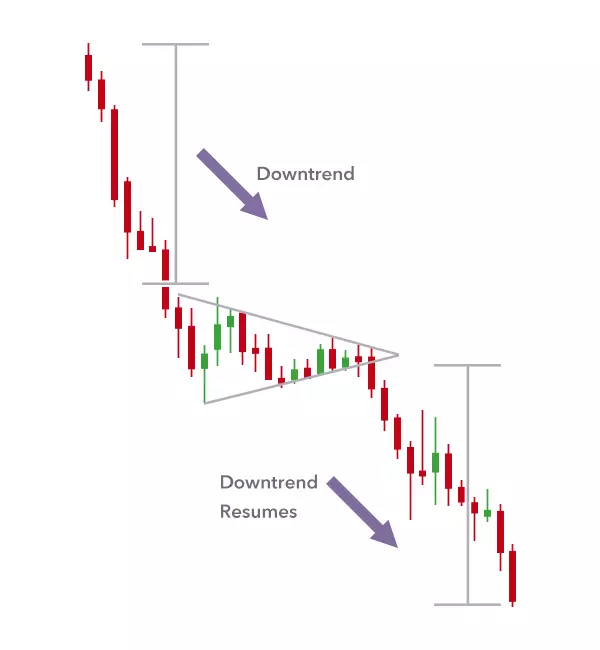
If there's no clear trend before the triangle, the market is equally likely to break out either to the upside or downside.
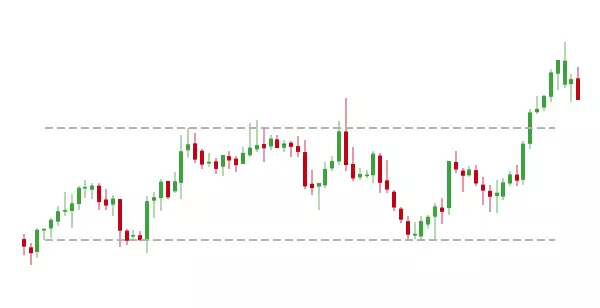
Rectangles
Similar to symmetrical triangles, these are continuation patterns that mark a consolidation period in the current trend before the price continues to move higher or lower. After a strong move, the market will often trade in a tight range between support and resistance levels, establishing a clear rectangle shape. After that the market tends to continue in the same direction.
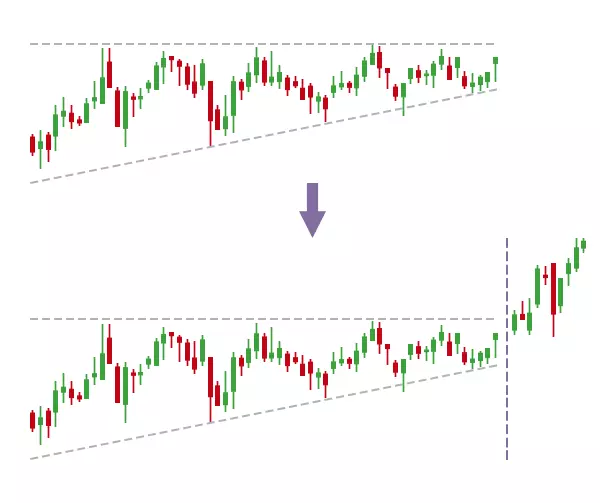
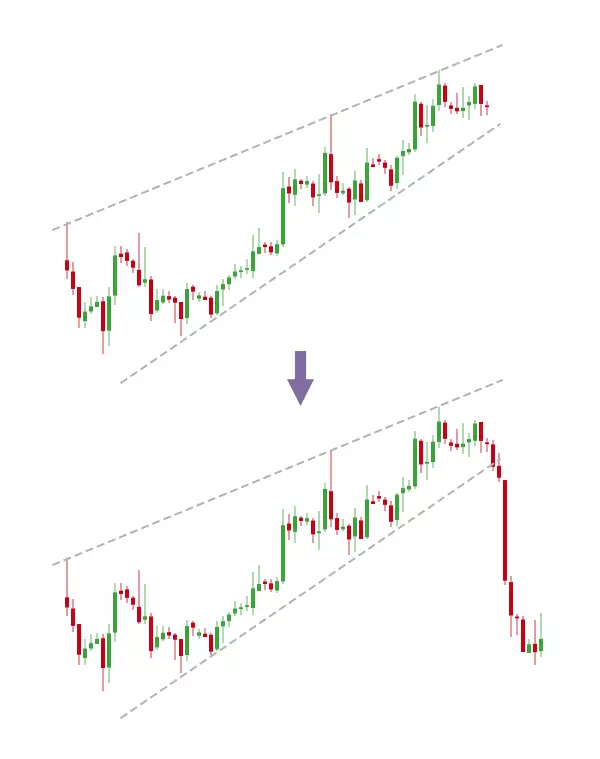
Wedges
Not to be confused with triangles, these patterns are formed when the price of a market begins to narrow into a tight range between two sloping trend lines.
A rising wedge occurs between two upwardly slanted lines of support and resistance. In this case the line of support is steeper than the resistance line. This pattern generally signals that the price will push lower.
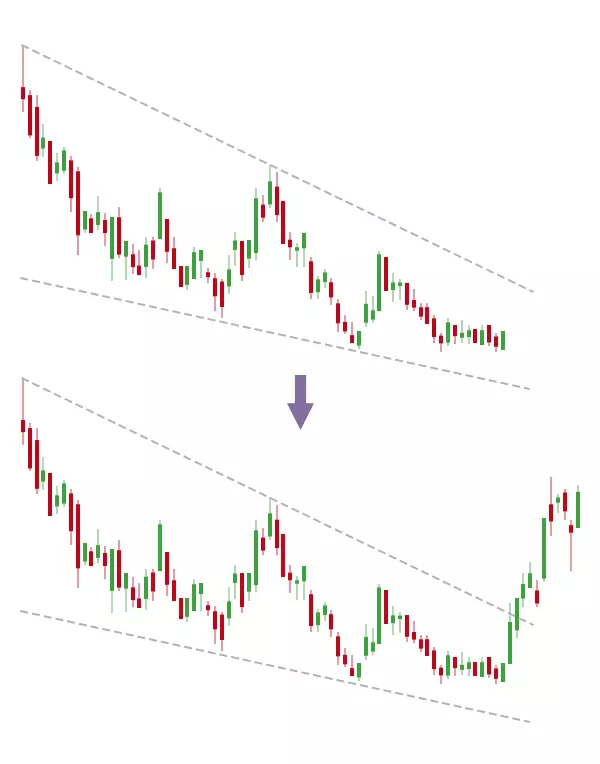
A falling wedge occurs between two downwardly sloping levels. In this case the line of resistance is steeper than the line of support, and usually signals that the price will rise.
Remember: chart patterns are not guaranteed
As we noted in the previous section, chart patterns are merely signals as to where the price of an asset might go in the future. With all chart patterns it's sensible to wait until the direction of the move has been established before placing your trade.
In some cases, when a breakout looks likely, it can even be a good strategy to set orders either side of the support/resistance/trend line. Then when one of the orders is triggered, you can cancel the other, hoping to catch the breakout whichever way it goes. However, this strategy is still susceptible to fakeouts, so whenever you place a trade it's important to set stops to limit your risk.
Lesson summary
- The following chart patterns suggest the market might break out to the downside:
- Rising wedge
- Descending triangle
- These patterns suggest the market might break out to the upside:
- Falling wedge
- Ascending triangle
- These continuation patterns suggest the market could continue in its current trend:
- Rectangles
- Symmetrical triangles
-
1
Introduction to technical analysis
3 min -
2
Types of charts
6 min -
3
Support and resistance
4 min -
4
Breakouts and fakeouts
4 min -
5
Trends and channels
4 min -
6
Basic chart patterns: part one
5 min -
7
Basic chart patterns: part two
6 min -
8
Candlestick patterns
7 min -
9
Moving averages
5 min -
10
Using moving averages
6 min -
11
Choosing your analysis tools
5 min -
Quiz
10 questions
CFDs are complex instruments and come with a high risk of losing money rapidly due to leverage. You do not own or have any interest in the underlying asset. You should consider whether you understand how CFDs work, and whether you can afford to take the high risk of losing your money. Please consider the Margin Trading Product Disclosure Statement (PDS), Risk Disclosure Notice and Target Market Determination before entering into any CFD transaction with us.
The value of shares, ETFs and ETCs bought through an IG share trading account can fall as well as rise, which could mean getting back less than you originally put in. Past performance is no guarantee of future results.
Please ensure you fully understand the risks and take care to manage your exposure.
The information on this website is prepared without considering your objectives, financial situation or needs. Consequently, you should consider the information in light of your objectives, financial situation and needs.
This website is operated by IG Australia Pty Ltd. IG Australia Pty Ltd is located on Level 32, Queen & Collins, 376-390 Collins Street, Melbourne, VIC 3000. ABN 93 096 585 410, Australian Financial Services Licence No. 515106. Derivatives Issuer Licence in New Zealand FSP No. 684191, NZBN 9429047618251.
The information on this site is not directed at residents of the United States or any particular country outside Australia or New Zealand and is not intended for distribution to, or use by, any person in any country or jurisdiction where such distribution or use would be contrary to local law or regulation.
© 2003 - 2026