The basics of technical analysis
Moving averages
So far we've just been looking at the various patterns that can appear in the movements of a price itself. However, there's a whole area of technical analysis dedicated to studying trading signals that are derived from the market price using mathematical calculations. These are called technical indicators, and they can be very useful weapons in a technical analyst's arsenal.
There are hundreds of indicators currently available, with analysts constantly working on new calculations to try and get an edge in the markets. Looking at all these in detail is beyond the scope of this course, but we will take a quick peek at one of the most popular and widely-used indicators out there - the moving average.
There are two main types of moving average:
- Simple
- Exponential
Simple moving average (MA or SMA)
Unsurprisingly given its name, the simple moving average simply plots the average price of a market over a specified period of time. Let's look at a daily GBP/USD chart with a 10-period MA overlaid on top:
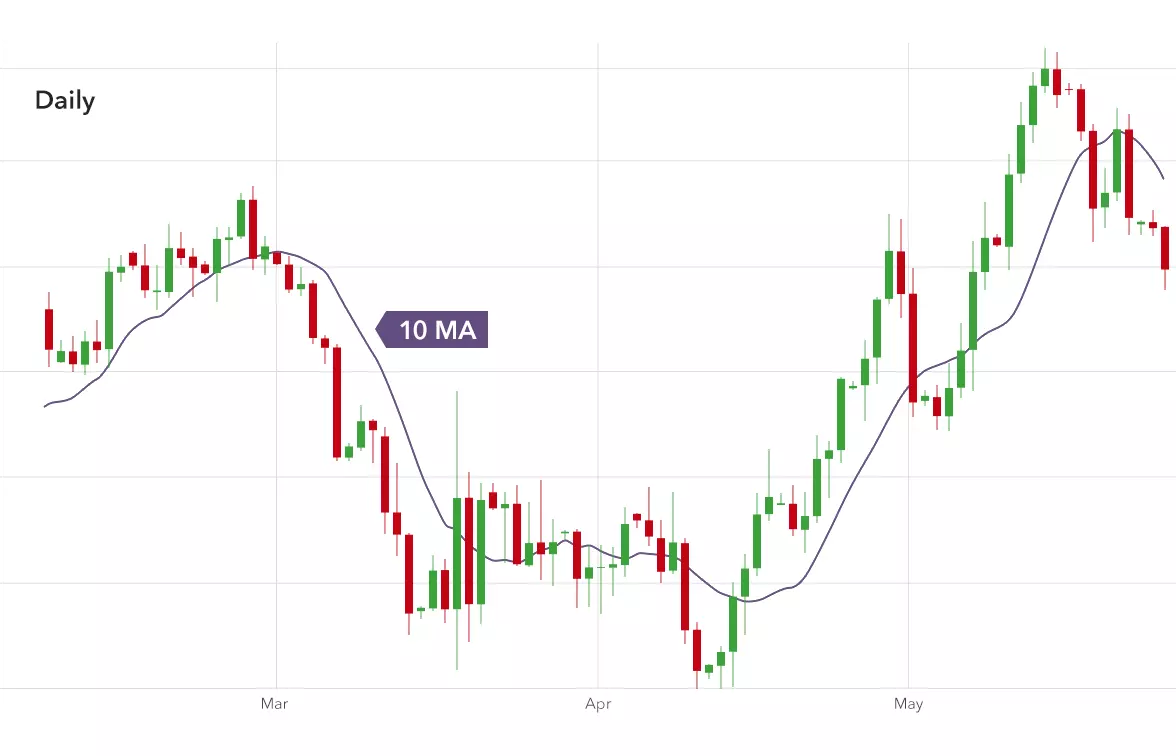
In this case, to get the simple moving average for a particular day, all you need to do is add up the closing price of the last ten periods (or days in this case) then divide them by ten to get the average. Join those averages together and you'll get the green line above. Fortunately, you generally don't have to do these calculations yourself - most charting packages have the option to add moving averages to the chart automatically.
Notice how the 10-period moving average seems to follow the price, but the line is smoother and lags somewhat. Now look what happens when you add a 20-period MA to the chart:

The 20-period moving average is even smoother and lags even further behind the price. Which isn't particularly surprising when you consider it's taking into account the last 20 periods rather than the last ten. For this reason, technical analysts would say that the 20-period MA is slower than the 10-period MA. Now let's add a 50-period MA:
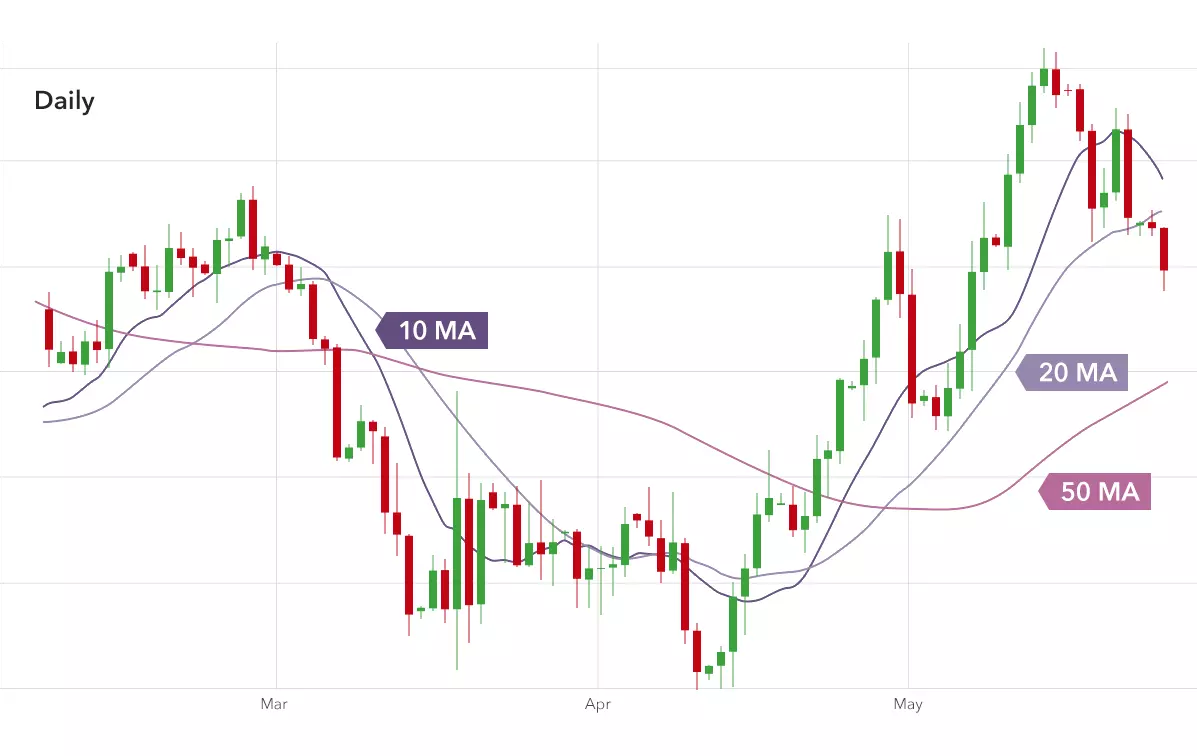
It's even smoother, with even more lag. Of the three moving averages, the 50 MA is the slowest while the 10 MA is the fastest.
Exponential moving average (EMA)
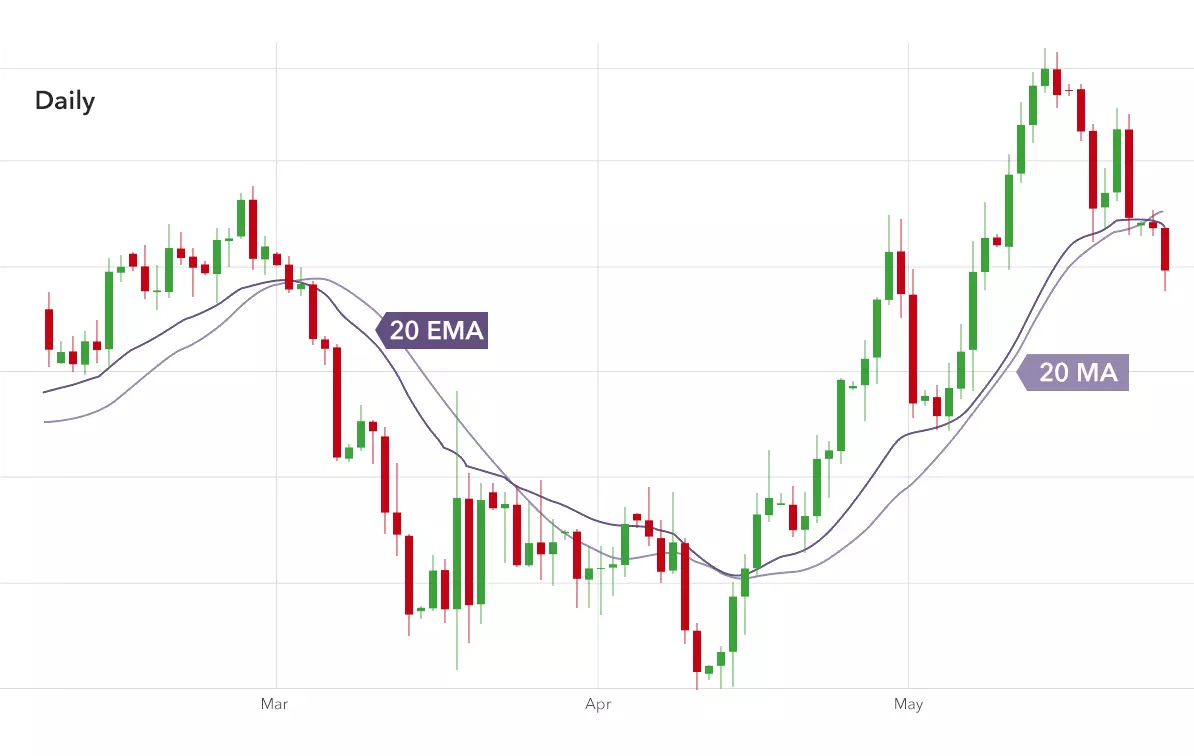
The exponential moving average works in pretty much the same way as the simple moving average, except it gives more weight to the more recent periods. This means the EMA is quicker to respond to price moves and tends to follow the underlying price more closely than the corresponding MA. Let's have a look at how the 20 EMA compares to the 20 MA on a daily GBP/USD chart:
Now here's the 50 EMA and the 50 MA:
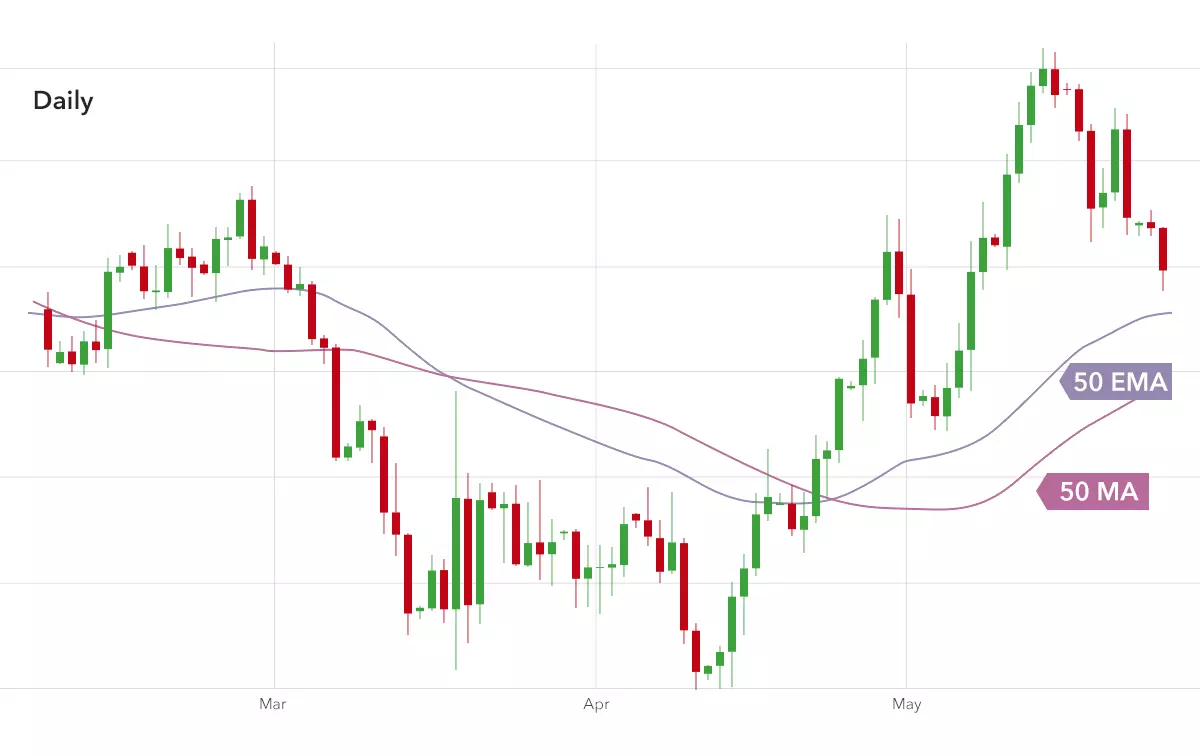
Because of how it's calculated, the EMA is more sensitive to price spikes in recent periods, but less sensitive to price spikes in periods that are further away. This can be useful information when using moving averages to trade, as we'll see in the next section.
Lesson summary
- Technical indicators are mathematical calculations derived from a market's price and often used to provide trading signals
- The simple moving average (MA or SMA) plots the average price of a market over a specified period of time
- The exponential moving average (EMA) is similar but gives more weight to recent periods
- Fast moving averages stick close to the market price, while slow moving averages are smoother and lag further behind
-
1
Introduction to technical analysis
3 min -
2
Types of charts
6 min -
3
Support and resistance
4 min -
4
Breakouts and fakeouts
4 min -
5
Trends and channels
4 min -
6
Basic chart patterns: part one
5 min -
7
Basic chart patterns: part two
6 min -
8
Candlestick patterns
7 min -
9
Moving averages
5 min -
10
Using moving averages
6 min -
11
Choosing your analysis tools
5 min -
Quiz
10 questions
Disclaimer:
All forms of investments carry risks and trading CFDs may not be suitable for everyone. CFDs are leveraged instruments and can result in losses that exceed deposits, so please ensure that you fully understand, and are aware of, the risks and costs involved. Refer to the Risk Disclosure Statement and Risk Fact Sheet.
IG Asia Pte Ltd (Co.Reg.No. 200510021K) is regulated by the Monetary Authority of Singapore and holds a capital markets services licence for dealing in capital markets products that are over-the-counter derivatives contracts and is an exempt financial adviser.
IG provides an execution-only service. The information in this advertisement does not contain (and should not be construed as containing) investment advice or an investment recommendation, or an offer of or solicitation for a transaction in any financial instrument. IG accepts no responsibility for any use that may be made of these comments and for any consequences that result. You should consider your specific investment objectives, financial situation or particular needs before making a commitment to trade, including seeking advice from an independent financial adviser regarding the suitability of the investment, under a separate engagement, as you deem fit.
The information on this site is not directed at residents of the United States or Belgium and is not intended for distribution to, or use by, any person in any country or jurisdiction where such distribution or use would be contrary to local law or regulation.
This advertisement has not been reviewed by the Monetary Authority of Singapore.
2006-2026
