The basics of technical analysis
Basic chart patterns: part one
As we've seen, when a market hits significant support or resistance, it tends to either bounce off or break through (apart from fakeouts, of course). Clearly, if you could forecast when the market was going to do which, you could make a huge amount of money.
Unfortunately, markets are unpredictable so that's not possible all the time, but the good thing about technical analysis is that various chart patterns tend to repeat themselves. If you can learn to recognise these patterns and when they start to form, then you can often gather clues about what the price is likely to do next.
Bear in mind these patterns are by no means foolproof and should just be used as guides as to the future direction of a market.
Double tops and bottoms
Double tops and double bottoms are reversal formations, signalling to chartists that a sustained trend may be about to reverse.
Double tops typically occur when two successive moves higher are sold into, creating two peaks on the chart. The low point between these two highs is known as the 'neckline', and the pattern culminates with a break through this level.
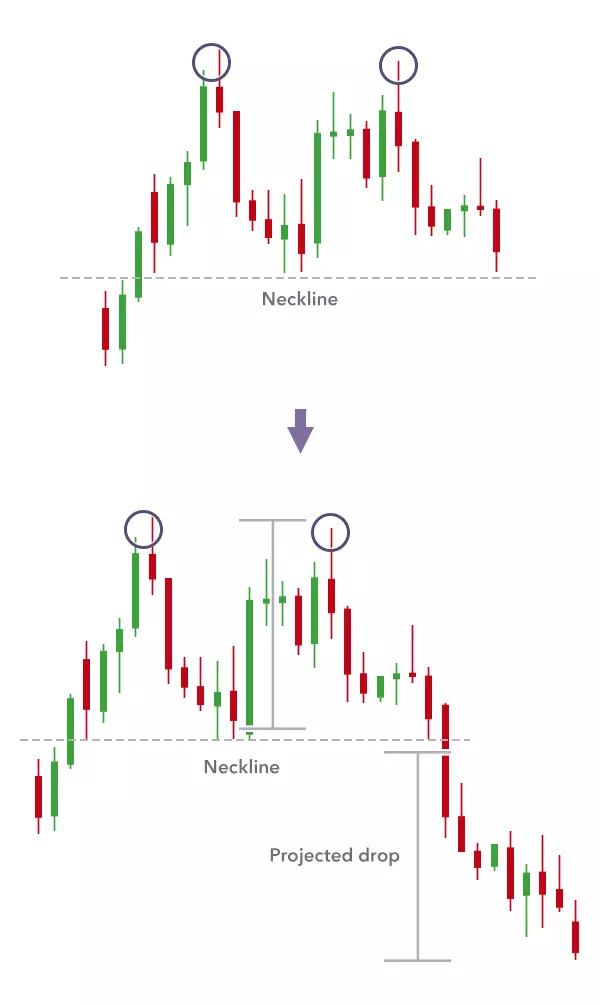
On this occasion you can see that the second top fails to break above the initial high. This indicates that the uptrend may have finished and a reversal is likely. If you're going to trade using this pattern it's sensible to enter your short trade below the neckline, when the pattern is fully formed (particularly as another pattern might be forming, such as a 'triple top' - see below).
The benefit of trading a pattern such as a double top is that it gives you a price target. In other words, you can project how far the price might fall after it breaks through the neckline. The drop is often likely to be equal to the distance from the neckline to the highest peak, as shown in blue on the chart above.
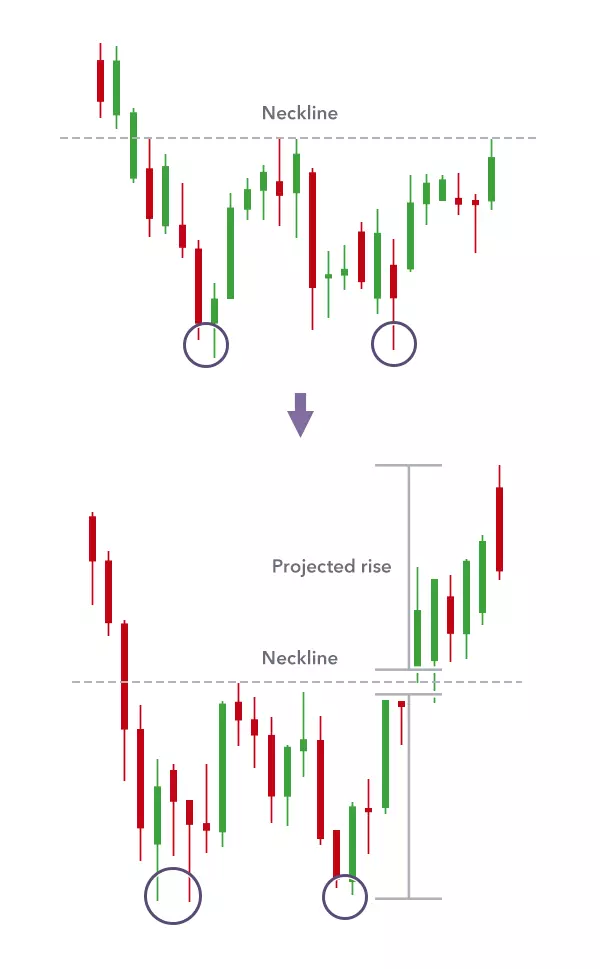
Double bottoms work the same way as double tops but in the opposite direction, indicating a bullish trend reversal after a sustained downtrend.
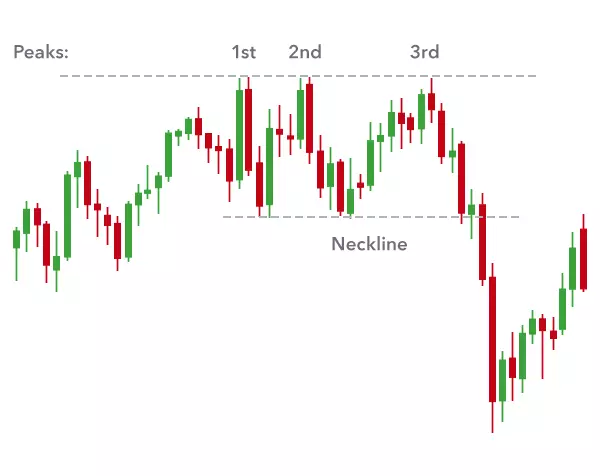
Triple tops and bottoms
The same as double tops and bottoms, except the market hits the support or resistance level three times before reversing.
Question
Correct
Incorrect
In a triple top, the market hits resistance three times before reversing.Question
Correct
Incorrect
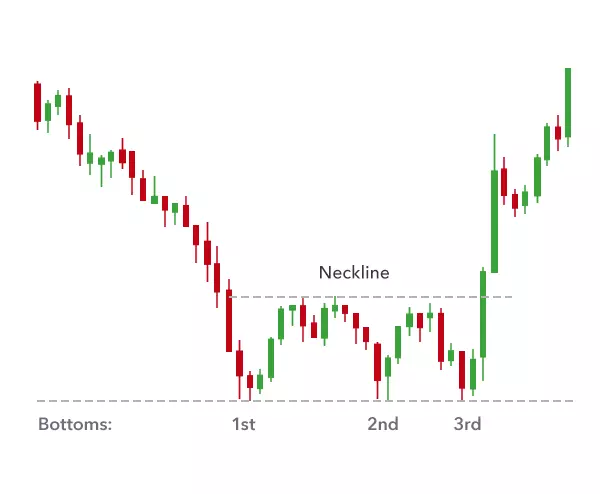
A triple bottom is when the market hits support three times before reversing.Head and shoulders
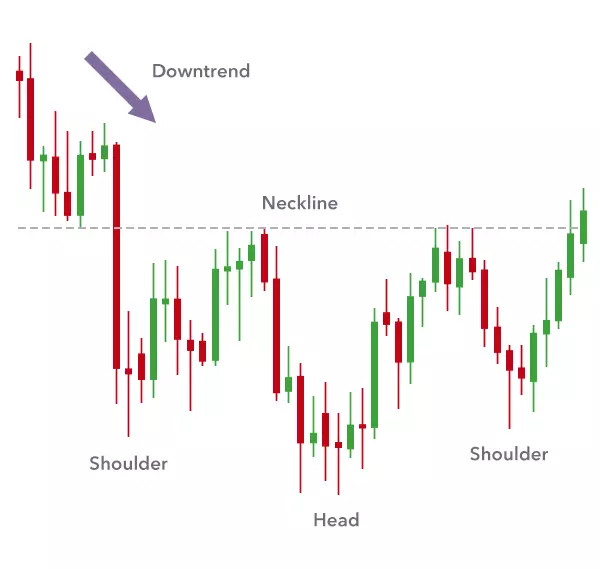
This is another pattern signalling a trend reversal. It's very similar to the triple top, but this time you get a peak (shoulder), followed by a higher peak (the head), followed by a lower peak (another shoulder). It looks a bit like this:
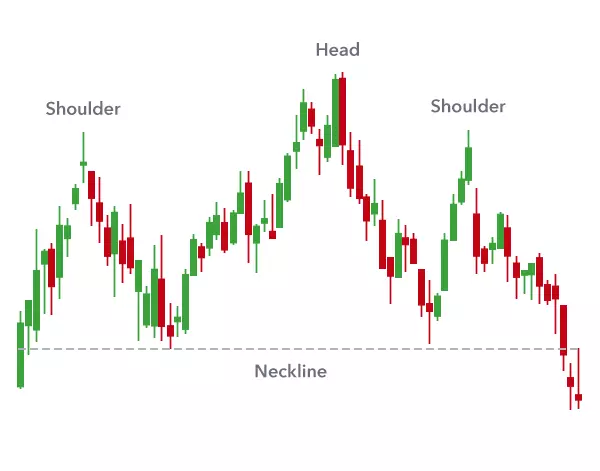
The neckline is formed between the two troughs on either side of the head. If the neckline's sloping down that's an even better indication of a reversal. You can calculate your target level based on the distance between the head and the neckline: just add that distance on to the breakout point.
It's worth noting that a head and shoulders pattern is only described as complete once the neckline is broken. At that point the target comes into play.
Inverse head and shoulder patterns work in the same way but in the other direction.
Lesson summary
- Chart patterns tend to repeat themselves, so you can use them to predict where a market might move next
- Reversal formations signal that a sustained trend may be about to reverse
- Continuation formations signal that a sustained trend may be about to continue
- The following chart patterns suggest the market might break out to the downside:
- Double tops
- Triple tops
- Head and shoulders
- These patterns suggest the market might break out to the upside:
- Double bottoms
- Triple bottoms
- Inverse head and shoulders
-
1
Introduction to technical analysis
3 min -
2
Types of charts
6 min -
3
Support and resistance
4 min -
4
Breakouts and fakeouts
4 min -
5
Trends and channels
4 min -
6
Basic chart patterns: part one
5 min -
7
Basic chart patterns: part two
6 min -
8
Candlestick patterns
7 min -
9
Moving averages
5 min -
10
Using moving averages
6 min -
11
Choosing your analysis tools
5 min -
Quiz
10 questions
CFDs are leveraged products. CFD trading may not be suitable for everyone and can result in losses that exceed your deposits, so please consider our Risk Disclosure Notice and ensure that you fully understand the risks involved.
This website is owned and operated by IG Bank S.A. Registered address at 42 Rue du Rhone, 1204 Geneva, authorised and regulated by FINMA.
The information on this site is not directed at residents of the United States and Belgium, or any particular country outside Switzerland and is not intended for distribution to, or use by, any person in any country or jurisdiction where such distribution or use would be contrary to local law or regulation.
@ 2003 – 2026