The basics of technical analysis
Trends and channels
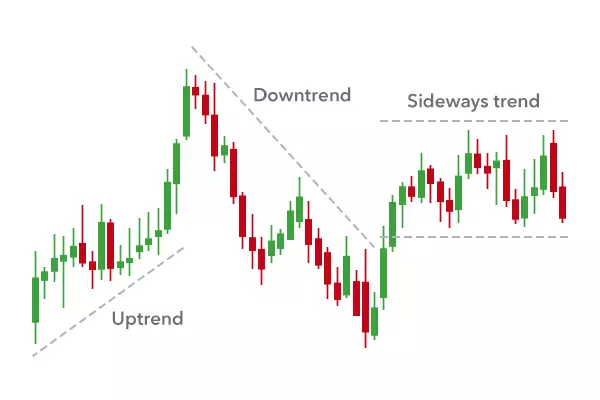
As you'll notice when you look at a chart, market prices do not generally rise or fall in straight lines over a period of time, but rather in a series of zigzags. The price will rise to a peak or a high, then drop to a trough or low. Despite this, the market will usually move in one overall direction or trend, and it's the relative positioning of the peaks and troughs that define this trend.
There are three types of market trend:
| Uptrend | For a market to be in an uptrend, each successive peak must be higher than the last, and each trough must also be higher than the preceding one. |
|---|---|
| Downtrend | For a market to be in a downtrend, there must be a series of successively lower peaks and lower troughs. |
| Sideways trend | In a sideways trend there's no clear pattern to the peaks and troughs, with the price generally oscillating in a fairly narrow range between support and resistance levels. |
Trends are fairly easy to plot on a chart - all you need to do is connect two major peaks or two major troughs with a line. If you've drawn them correctly, trend lines will often act similarly to support and resistance levels. However, you should note that:
- It only takes two peaks or troughs to draw a trend line, but it takes three to confirm the trend
- Just like support and resistance levels, the more times the trend line is tested, the stronger it is said to be
- Steeper trend lines tend to be unreliable and break easily
Channels
Channels are an extension of trend lines and are another way of identifying buying and selling areas on a chart. To create a channel, you need to draw two trends lines - one joining peaks and one joining troughs.
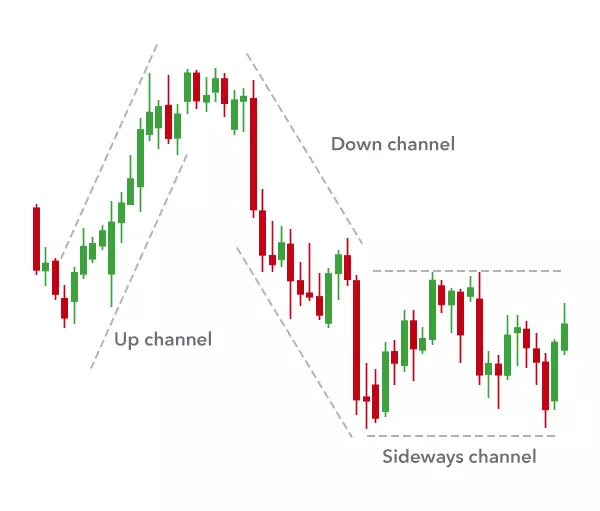
Once drawn, the bottom of the channel can be used as a buying area, while the top can be employed as a selling area (unless you're looking to profit from breakouts of course, where the reverse holds true).
Question
Correct
Incorrect
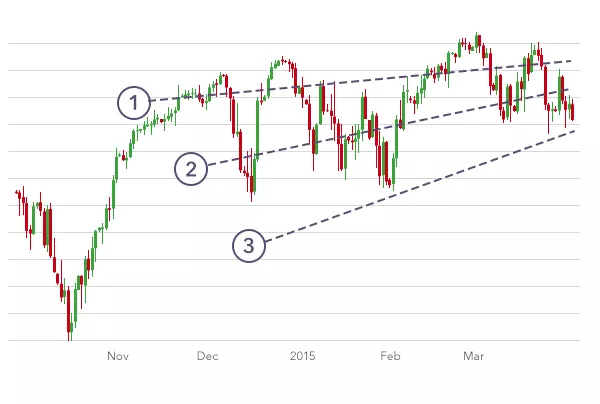
Lines 1 and 2 cut through the peaks and troughs. Line 3 connects two major troughs, so is the only trend line that's drawn correctly.Lesson summary
- An uptrend is characterised by a series of higher peaks and higher troughs
- A downtrend is formed during a series of lower peaks and lower troughs
- A sideways trend has no true pattern
- A trend line connects two major peaks or two major troughs
- Trend lines are only confirmed if the price touches them at least three times
- The more the market price touches a trend line, the stronger it is seen to be
- Channels are an extension of trend lines and can be used to identify buying and selling areas
-
1
Introduction to technical analysis
3 min -
2
Types of charts
6 min -
3
Support and resistance
4 min -
4
Breakouts and fakeouts
4 min -
5
Trends and channels
4 min -
6
Basic chart patterns: part one
5 min -
7
Basic chart patterns: part two
6 min -
8
Candlestick patterns
7 min -
9
Moving averages
5 min -
10
Using moving averages
6 min -
11
Choosing your analysis tools
5 min -
Quiz
10 questions