Asia Day Ahead: Risk sentiments on the defensive, Nikkei back to retest support confluence
Major US indices ended mixed last Friday despite lower bond yields, with the S&P 500 registering its second week of losses to reach correction territory.


Market Recap
Major US indices ended mixed last Friday (DJIA -1.12%; S&P 500 -0.48%; Nasdaq +0.38%) despite lower bond yields, with the S&P 500 registering its second week of losses to reach correction territory while the VIX reverted to trade back above its key 20 level. As the indices’ market breadth heads further into oversold territory and the CNN Fear and Greed Index dips back into ‘extreme fear’, there may be attempts for some short-term relief this week, but buyers may still face the arduous task of seeking out bullish catalysts to sustain any rallies.
Optimism around Amazon’s earnings last Friday were quickly overridden by risks of conflict escalation in the Middle East, while the closely-watched US Personal Consumption Expenditure (PCE) inflation data did not offer much room for the Federal Reserve (Fed) to stand down on its hawkish tone ahead of its upcoming meeting. While the September inflation figures came in line with market expectations, more persistence in core service-sector prices has been the cause for concern, given that it is what the Fed places greater focus on.
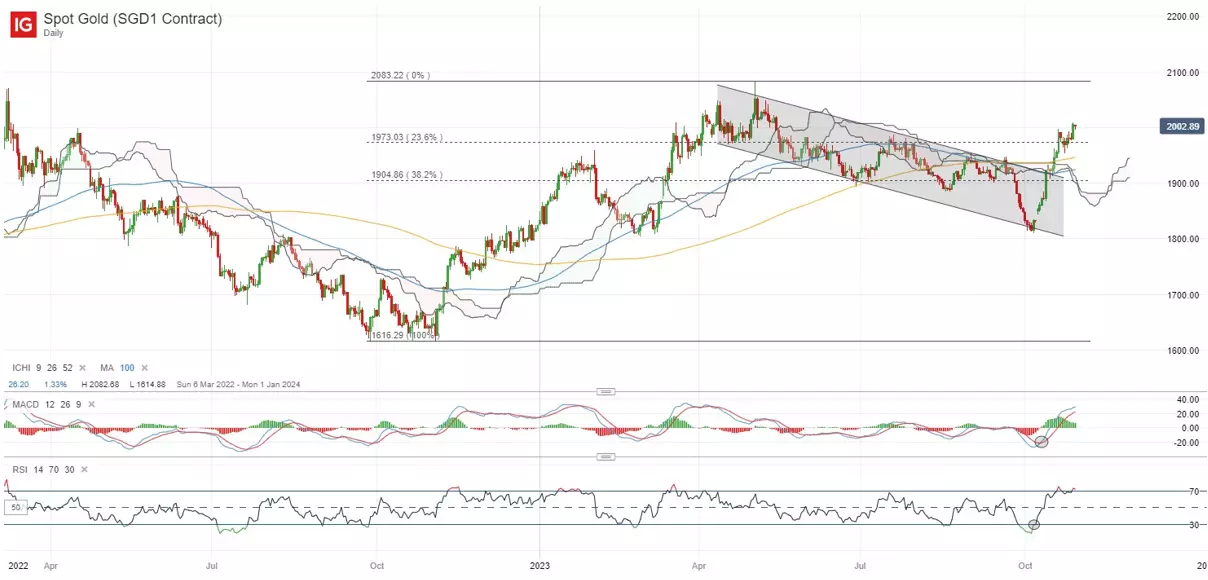
Brent crude were up 3%, while gold prices pushed to a new five-month high, reflecting some expectations in place that tensions in Israel and Gaza could escalate into a wider geopolitical conflict. The safe-haven gold has reclaimed its key psychological US$2,000 level, while prices have traded above its Ichimoku cloud on the daily chart as reflection of buyers in greater control for now. Any near-term signs of exhaustion from buyers may come from any reversal back below the US$1,973 level, which may then leave the US$1,940 level on watch next.
Asia Open
Asian stocks look set for a downbeat open, with Nikkei -0.88%, ASX -0.76% and KOSPI -0.10% at the time of writing. The mixed handover from Wall Street, along with upside risks to oil prices on rising geopolitical tensions, kept sentiments in its cautious state to start the week as a series of key risk events looms. Investors will also digest a Biden-Xi meeting next month, announced just over the weekend. Although that may indicate a potential first step towards the thawing of US-China ties, gridlock around technology competition and geopolitical issues is likely to remain. Nevertheless, investors could be watching more of the tone from the meeting with regard to any intention to lay the groundwork for further cooperation, as opposed to any concrete outcome.
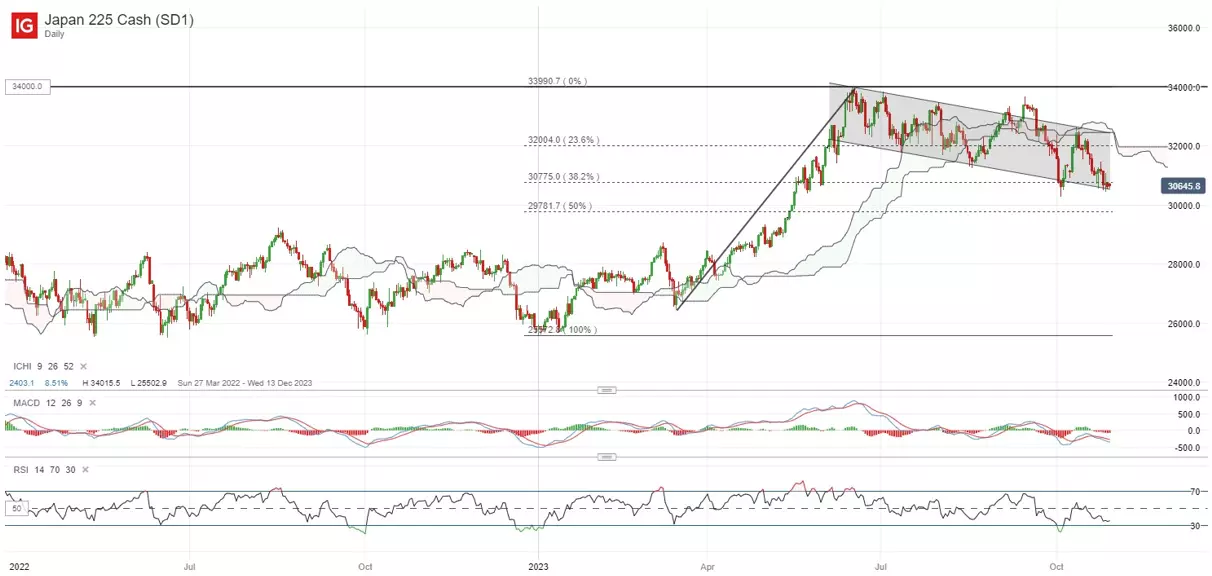
Aside, as we head into the Bank of Japan (BoJ) policy decision tomorrow, the Nikkei 225 index is back at a support confluence, where a lower channel trendline coincides with a key Fibonacci retracement. Japanese 10-year bond yields are currently hovering at its decade high, alongside a surge in implied volatility for the 10-year government bonds futures, which reflects speculations in place for potential policy tweaks. Fresh updates of economic forecasts will also provide clues on the pace of policy normalisation ahead, with any subsequent breakdown of the downward trendline in the Nikkei 225 index potentially paving the way to retest the 29,800 level next.
On the watchlist: US dollar on watch ahead of FOMC meeting
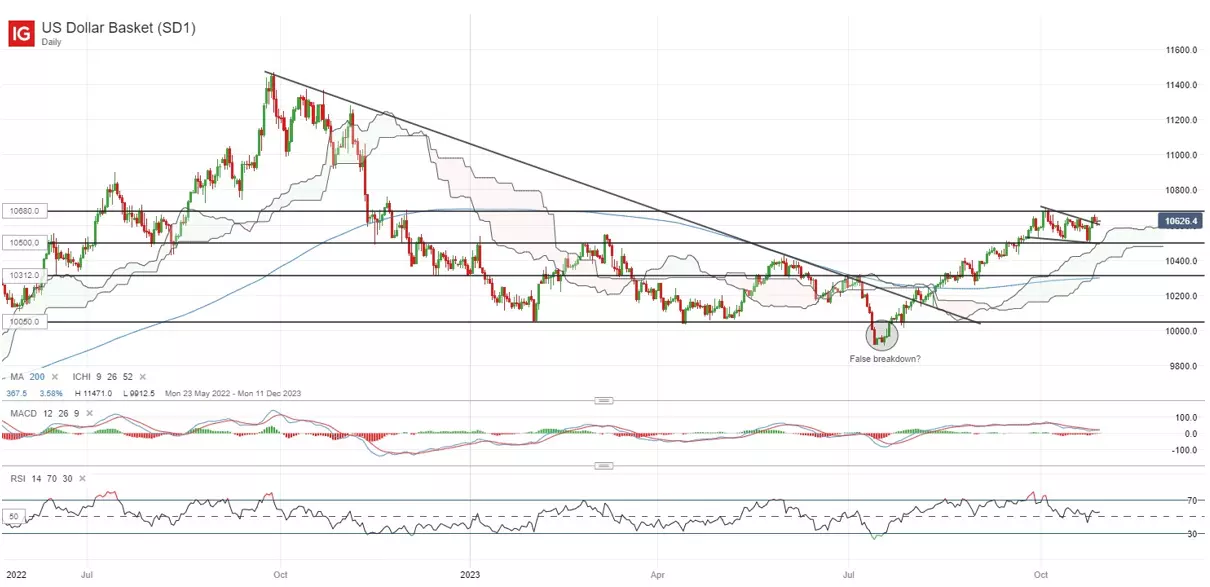
Despite longer-term US yields pushing to a new higher high over the past weeks, the US dollar has failed to do so, reflecting some near-term reservations as we head into the upcoming Federal Open Market Committee (FOMC) meeting. Nevertheless, it continues to consolidate around its year-to-date high, which some may point towards a bullish pennant still in place. For now, the broader upward trend remains intact as the US dollar trades above its Ichimoku cloud on its daily chart, but the year-to-date high at the 106.80 level will provide the next level of resistance to overcome. Failure to do so may bring a retest of the 105.00 level, where a near-term support confluence stands.
Friday: DJIA -1.12%; S&P 500 -0.48%; Nasdaq +0.38%, DAX -0.30%, FTSE -0.86%
IGA, may distribute information/research produced by its respective foreign affiliates within the IG Group of companies pursuant to an arrangement under Regulation 32C of the Financial Advisers Regulations. Where the research is distributed in Singapore to a person who is not an Accredited Investor, Expert Investor or an Institutional Investor, IGA accepts legal responsibility for the contents of the report to such persons only to the extent required by law. Singapore recipients should contact IGA at 6390 5118 for matters arising from, or in connection with the information distributed.
The information/research herein is prepared by IG Asia Pte Ltd (IGA) and its foreign affiliated companies (collectively known as the IG Group) and is intended for general circulation only. It does not take into account the specific investment objectives, financial situation, or particular needs of any particular person. You should take into account your specific investment objectives, financial situation, and particular needs before making a commitment to trade, including seeking advice from an independent financial adviser regarding the suitability of the investment, under a separate engagement, as you deem fit.
No representation or warranty is given as to the accuracy or completeness of this information. Consequently, any person acting on it does so entirely at their own risk. Please see important Research Disclaimer.
Please also note that the information does not contain a record of our trading prices, or an offer of, or solicitation for, a transaction in any financial instrument. Any views and opinions expressed may be changed without an update.

Seize a share opportunity today
Go long or short on thousands of international stocks.
- Increase your market exposure with leverage
- Get spreads from just 0.1% on major global shares
- Trade CFDs straight into order books with direct market access
Live prices on most popular markets
- Forex
- Shares
- Indices
See more forex live prices
See more shares live prices
Prices above are subject to our website terms and agreements. Prices are indicative only. All shares prices are delayed by at least 15 mins.
See more indices live prices
Prices above are subject to our website terms and agreements. Prices are indicative only. All shares prices are delayed by at least 20 mins.
