Cautious sentiments with US CPI up ahead: US dollar, Hang Seng Index, Gold
Sentiments tread in its cautious wait-and-see mode, with the US CPI and FOMC minutes lined up on the calendar this week.


Market Recap
Following the Good Friday holiday, US equities were largely flat overnight (DJIA +0.30%; S&P 500 +0.10%; Nasdaq -0.03%), but the sharp paring of initial losses mid-day suggests that buyers may remain in control for now. The Nasdaq 100 index was down as much as 1.2% at one point, but was only 0.03% lower by the close. The VIX continued to hover near its 2023 lows, failing to move past the key 20 level upon a retest, which still denotes a less stressful risk environment for now.
Nevertheless, sentiments tread in its cautious wait-and-see mode, with the US Consumer Price Index (CPI) and Federal Open Market Committee (FOMC) minutes lined up on the calendar this week. The recent US job report had swayed market rate expectations to lean towards another 25 basis-point hike in May (74% probability), but wide consensus is still rooting for a cumulative 50 basis-point rate cuts in 2023, which still goes against recent Federal Reserve (Fed) policymakers’ views. With that, all eyes will be on the upcoming inflation data to drive rate expectations once more, with any higher-than-expected read likely to support a higher US dollar and lower equities.
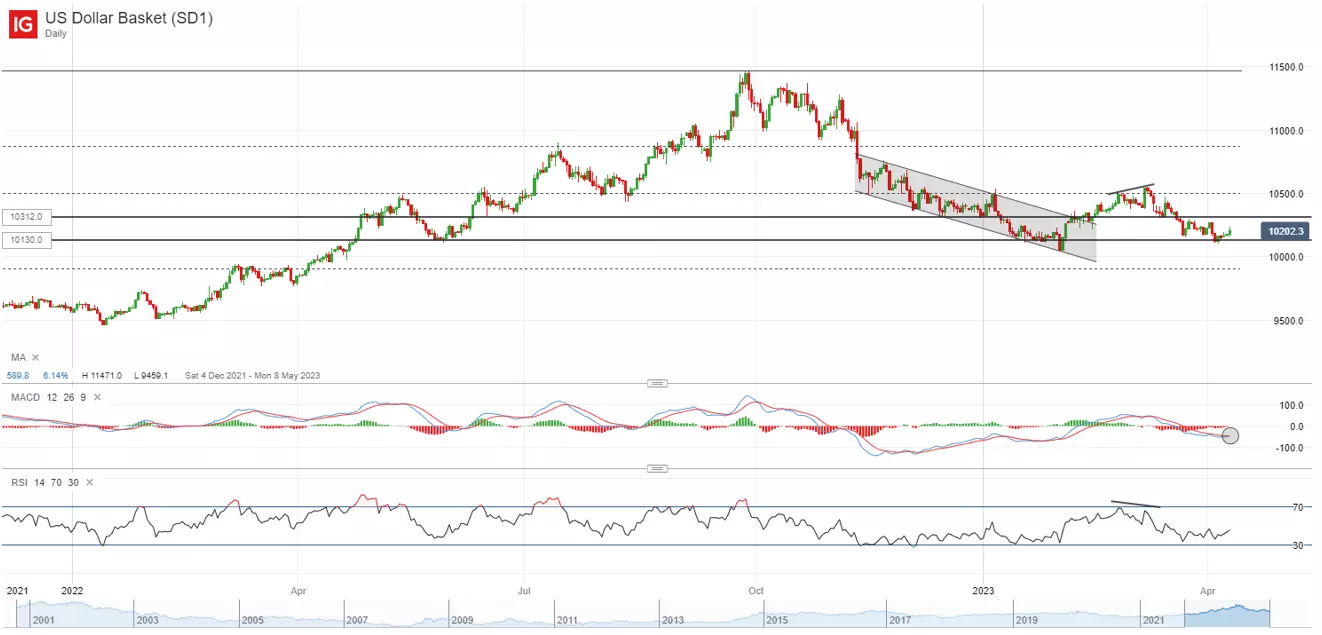
The US dollar is hovering back at its 101.30 support level, with the moving average convergence/divergence (MACD) forming a near-term bullish crossover. That said, whether the US dollar can form a renewed bullish trend remains the unlikely scenario, with several resistance up ahead to overcome. Immediate resistance may be at the 103.12 level, followed by the 105.00 level. On the other hand, any breakdown of the 101.30 level could pave the way towards the 99.00 level, where a key Fibonacci level stands.
Asia Open
Asian stocks look set for a positive open, with Nikkei +0.87%, ASX +1.26% and KOSPI +0.51% at the time of writing. The Bank of Korea has held rates steady for the second straight meeting at 3.5%, with the largely expected move bringing about a fairly contained reaction in the KOSPI. All eyes will be on the news conference next to provide views of policy outlook, but murky global demand and moderating pricing pressures will likely support a no-change for now, therefore little surprise may be expected.
Market participants will also have their eyes on China’s inflation figures. With some dampening of reopening optimism recently, a revival in pricing pressures will be on watch to support stronger economic prospects in China. Current expectations are for a tepid 1% rise in China’s inflation rate for March, unchanged from the previous month.
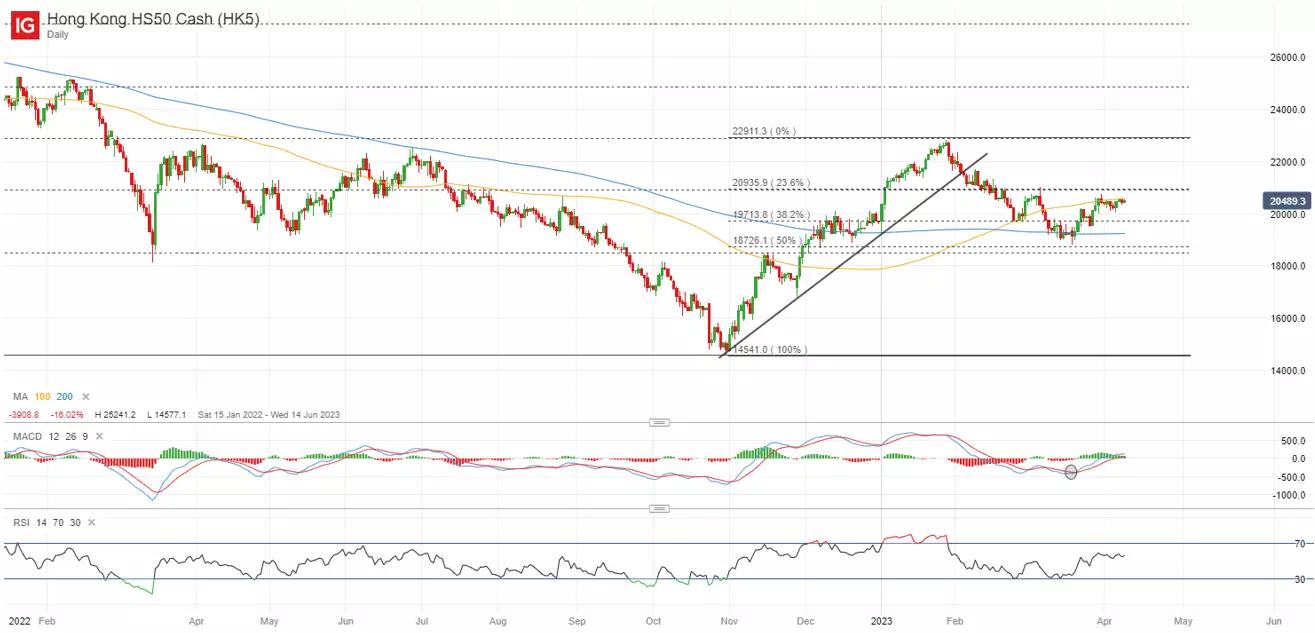
The Hang Seng Index has defended its 200-day moving average (MA) last month, but the 21,000 level may be a strong resistance level to overcome, with its 100-day MA and a Fibonacci confluence zone in place. Nevertheless, holding above its 200-day MA still keeps its longer-term upward trend intact. Any successful attempt in moving past the 21,000 level could be on watch to pave the way to retest its January 2023 high at the 22,900 level.
On the watchlist: Pause on gold prices’ rally on near-term bearish divergence?
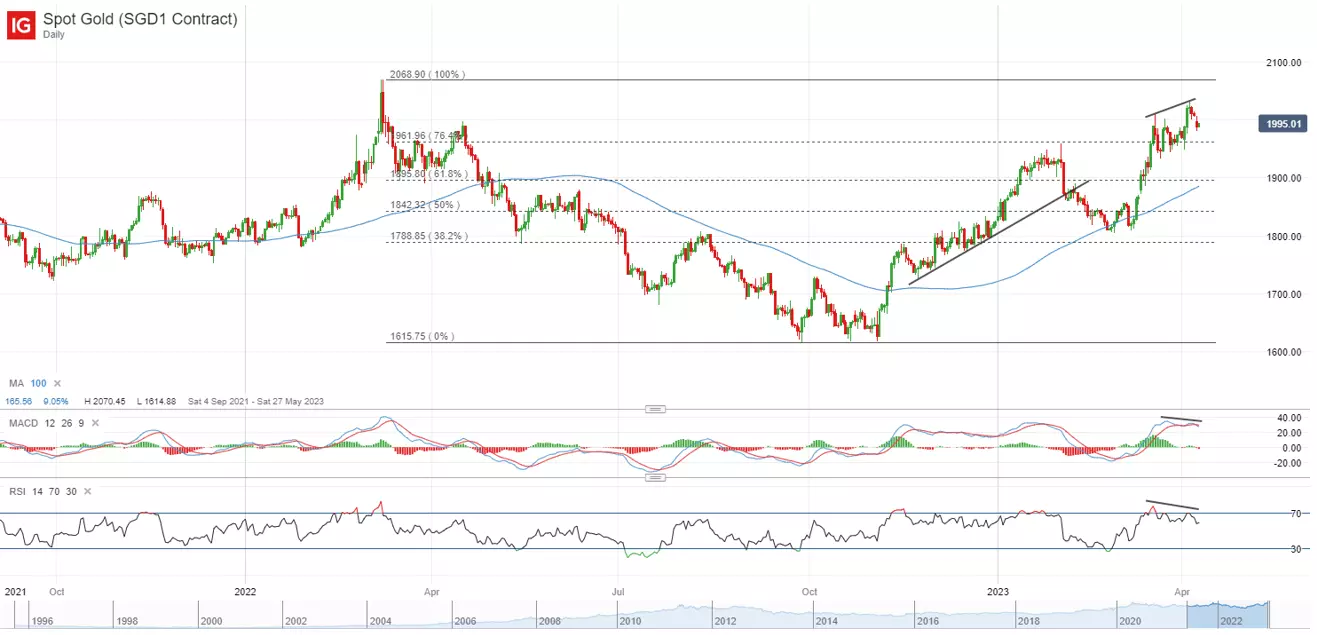
Gold prices’ attempt to stay above its key psychological US$2,000 level has been short-lived thus far, as mounting bets of additional Fed tightening firmed up the US dollar and Treasury yields, which puts a pause on the yellow metal’s rally. On the technical front, recent higher price highs were also met with a bearish divergence on both Relative Strength Index (RSI) and MACD, suggesting some moderating upward momentum. A look at the IG client sentiment also points to a short-term bearish contrarian trading bias, with 58.63% of traders in net-long positions and a further net-long build-up from last week.
A retracement will leave the US$1,940-1,960 level on watch for any support of a new higher low, which marked the lower end of its recent consolidation phase. Failure to defend this level may pave the way to retest the US$1,895 level. On the medium term, however, the trend remains upward bias as we continue to edge closer towards a potential rate pause from the Fed, while market pricing for higher recession risks could keep bond yields in check over the coming months.
Monday: DJIA +0.30%; S&P 500 +0.10%; Nasdaq -0.03%
IGA, may distribute information/research produced by its respective foreign affiliates within the IG Group of companies pursuant to an arrangement under Regulation 32C of the Financial Advisers Regulations. Where the research is distributed in Singapore to a person who is not an Accredited Investor, Expert Investor or an Institutional Investor, IGA accepts legal responsibility for the contents of the report to such persons only to the extent required by law. Singapore recipients should contact IGA at 6390 5118 for matters arising from, or in connection with the information distributed.
The information/research herein is prepared by IG Asia Pte Ltd (IGA) and its foreign affiliated companies (collectively known as the IG Group) and is intended for general circulation only. It does not take into account the specific investment objectives, financial situation, or particular needs of any particular person. You should take into account your specific investment objectives, financial situation, and particular needs before making a commitment to trade, including seeking advice from an independent financial adviser regarding the suitability of the investment, under a separate engagement, as you deem fit.
No representation or warranty is given as to the accuracy or completeness of this information. Consequently, any person acting on it does so entirely at their own risk. Please see important Research Disclaimer.
Please also note that the information does not contain a record of our trading prices, or an offer of, or solicitation for, a transaction in any financial instrument. Any views and opinions expressed may be changed without an update.

Seize a share opportunity today
Go long or short on thousands of international stocks.
- Increase your market exposure with leverage
- Get spreads from just 0.1% on major global shares
- Trade CFDs straight into order books with direct market access
Live prices on most popular markets
- Forex
- Shares
- Indices
See more forex live prices
See more shares live prices
Prices above are subject to our website terms and agreements. Prices are indicative only. All shares prices are delayed by at least 15 mins.
See more indices live prices
Prices above are subject to our website terms and agreements. Prices are indicative only. All shares prices are delayed by at least 20 mins.
