Positive start to the week as US CPI looms: Gold, Straits Times Index, Brent crude
Wall Street delivered a positive start to the week, with strength in rate-sensitive tech reflecting some confidence that the Fed’s tightening cycle will be heading towards its final phase.


Market Recap
Wall Street delivered yet another positive start to the new trading week (DJIA +0.56%; S&P 500 +0.93%; Nasdaq +1.53%), with strength in rate-sensitive tech reflecting some confidence that the Federal Reserve’s (Fed) tightening cycle will be heading towards its final phase. A fall in US consumers’ short-term inflation outlook to its lowest reading since May 2021 may provide some conviction overnight, although the upcoming US Consumer Price Index (CPI) data will still have the greater say. It will be the final piece of data to drive some last-minute adjustment in rate expectations ahead of the upcoming Federal Open Market Committee (FOMC) meeting.
Further progress on the inflation front is expected to be the story from the year-on-year readings, with headline and core inflation projected to ease to 4.1% and 5.3% respectively from a year ago. That said, market focus could be concentrated on the month-on-month core figure as well, which is expected to turn in a 0.4% increase (unchanged from April) as a reflection of some persistence in pricing pressures. Overall, the broader trend of moderating inflation over the past months may still allow the Fed to retain its guidance for a rate pause at the upcoming meeting for some wait-and-see, but leave the option of another hike in July on the table with a highlight of its data-dependent stance.
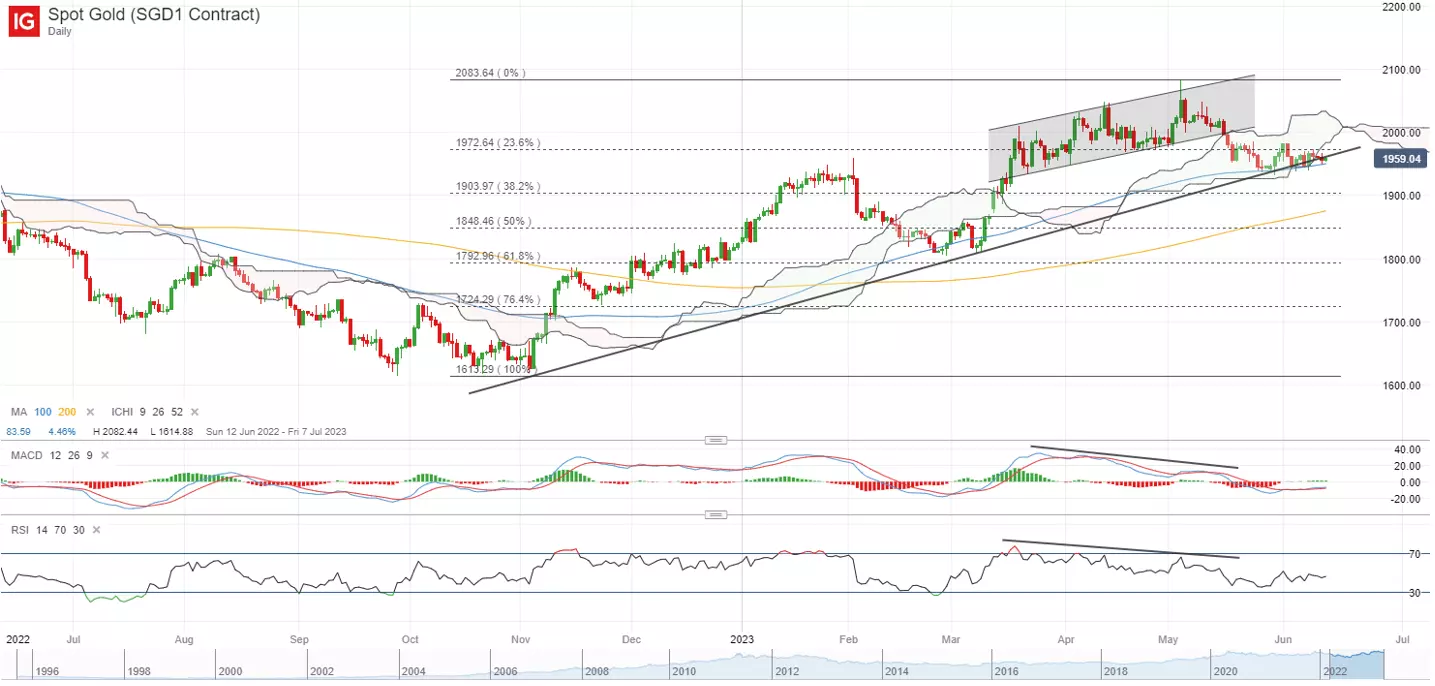
US Treasury yields were slightly lower, with the two-year still hovering near its May 2023 high. That kept gold prices in its consolidating moves just barely above a key upward trendline support. Consolidation at support may drain the supplies of sellers and raises the chances of a downward break. That will leave the US$1,940 level as a key immediate support to hold, with any move below the level pointing to a breakdown of its 100-day moving average (MA) as well, and could pave the way towards the US$1,900 level next.
Asia Open
Asian stocks look set for a generally upbeat open, with Nikkei +0.92%, ASX -0.29% and KOSPI +0.38% at the time of writing. Chinese equities continue to diverge in terms of performance, with the Nasdaq Golden Dragon China Index down 0.1% overnight despite the risk-on environment. Australia kicks off the morning with consumer sentiment number delivering a slight beat (+0.2% versus 0% forecast), although the recent surprise rate hike by the Reserve Bank of Australia (RBA) may not have been fully factored in.
Despite the rally in Wall Street over the past month, the Straits Times Index (STI) has not been gaining much traction, as sellers seem to be taking advantage of any rebound attempts as an opportunity to pare their exposure. Its value-focused composition may be a reason for the trailing performance with strength in growth sectors taking the bulk of investors’ attention lately.
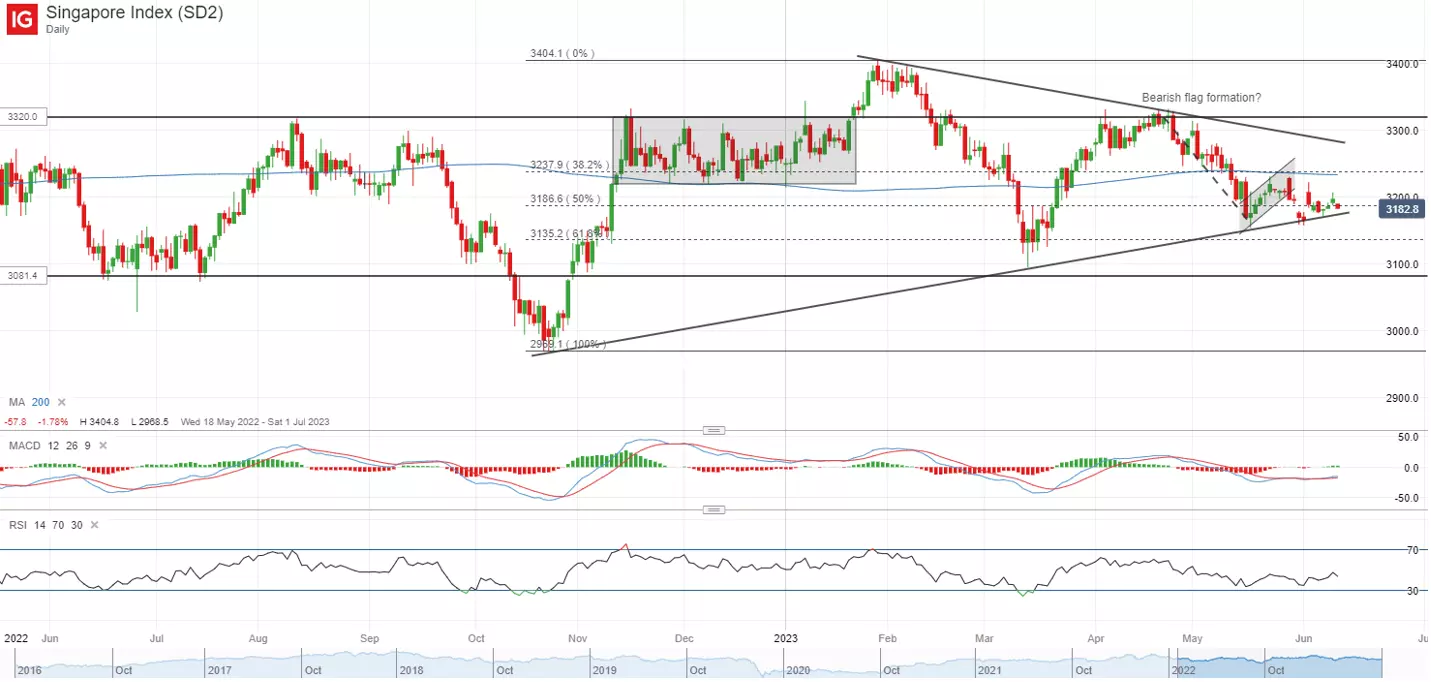
The recent Singapore Exchange (SGX) fund flow data has revealed the fourth straight month of net outflows from institutional investors, with the month of May seeing another S$602 million of net outflows. On the technical front, the index is still hanging above a key upward trendline in place since October 2022. The broader risk-on environment may aid to provide some near-term support for the index, but should the 3,170 level fail to hold over the coming weeks, it could leave its March 2023 bottom in sight. For now, a bearish flag formation remains intact on the daily chart, with a breakdown in late-May suggesting a potential medium-term price target of 3,045.
On the watchlist: Brent crude prices back to retest its May 2023 bottom
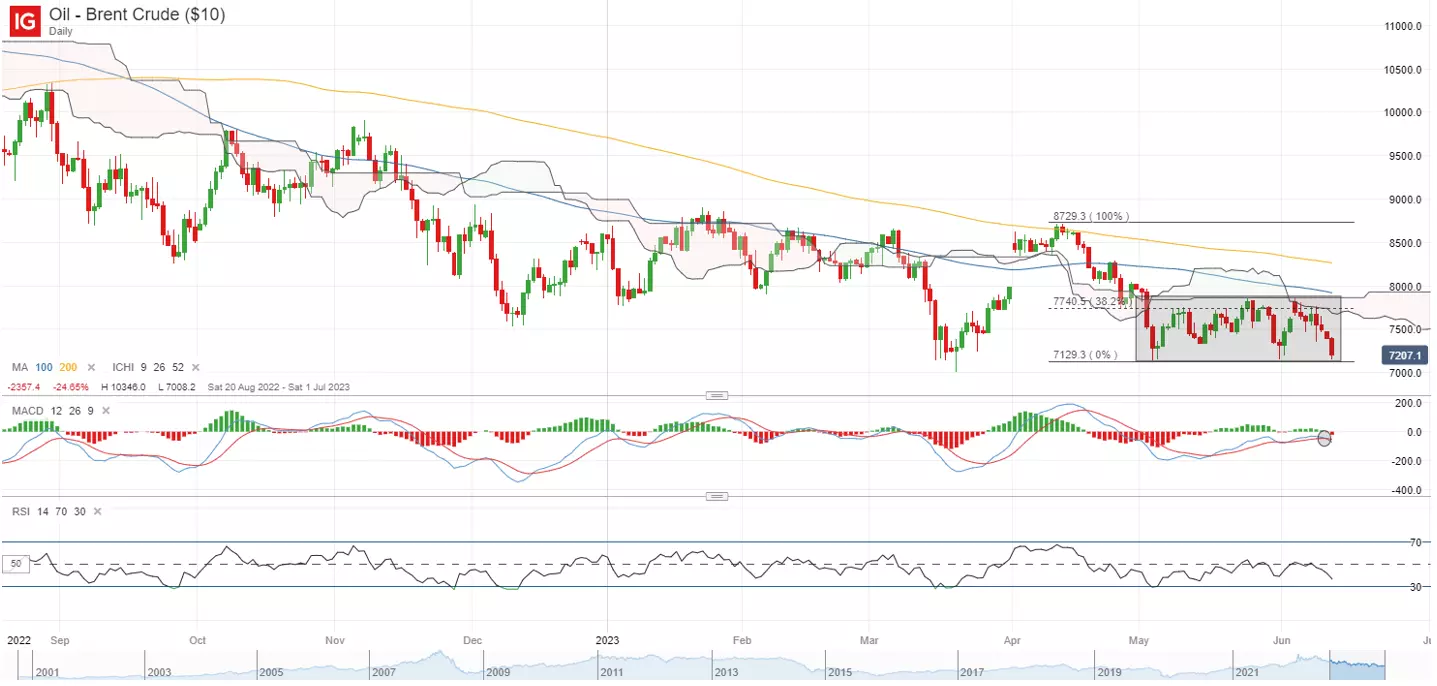
Oil prices have been struggling to move higher over the past week, failing to find much conviction from Saudi production cut and the broader risk-on environment to break above its near-term ranging pattern. Overnight, downbeat forecasts from analysts pointing to a less tight situation for oil seem to be the headline, dragging Brent crude prices back to its May 2023 bottom at the US$71.30 level.
Its Relative Strength Index (RSI) continues to trend below the key 50 level as a reflection of sellers in control, while prices failed to cross above its Ichimoku cloud resistance on the daily chart last week. The US$71.30 level will be a crucial support to hold, where dip-buying efforts were observed on previous three occasions this year. Failure to defend this level may pave the way to the US$65.80 level next. To provide any conviction for the bulls, a move above the US$80.00 level may be warranted to support a break above the Ichimoku cloud resistance and its ranging pattern.
Monday: DJIA +0.56%; S&P 500 +0.93%; Nasdaq +1.53%, DAX +0.93%, FTSE +0.11%
This information has been prepared by IG, a trading name of IG Australia Pty Ltd. In addition to the disclaimer below, the material on this page does not contain a record of our trading prices, or an offer of, or solicitation for, a transaction in any financial instrument. IG accepts no responsibility for any use that may be made of these comments and for any consequences that result. No representation or warranty is given as to the accuracy or completeness of this information. Consequently any person acting on it does so entirely at their own risk. Any research provided does not have regard to the specific investment objectives, financial situation and needs of any specific person who may receive it. It has not been prepared in accordance with legal requirements designed to promote the independence of investment research and as such is considered to be a marketing communication. Although we are not specifically constrained from dealing ahead of our recommendations we do not seek to take advantage of them before they are provided to our clients.

Seize a share opportunity today
Go long or short on thousands of international stocks.
- Increase your market exposure with leverage
- Get commission from just 0.08% on major global shares
- Trade CFDs straight into order books with direct market access
Live prices on most popular markets
- Forex
- Shares
- Indices