GBP/USD, USD/JPY rallies stall while AUD/USD slips as greenback fights back
GBP/USD, USD/JPY rallies stall while AUD/USD slips as the US dollar recovers ahead of Eurozone PMI and PPI data, US ISM services PMI and factory orders as well as a speech by FOMC member Barr.


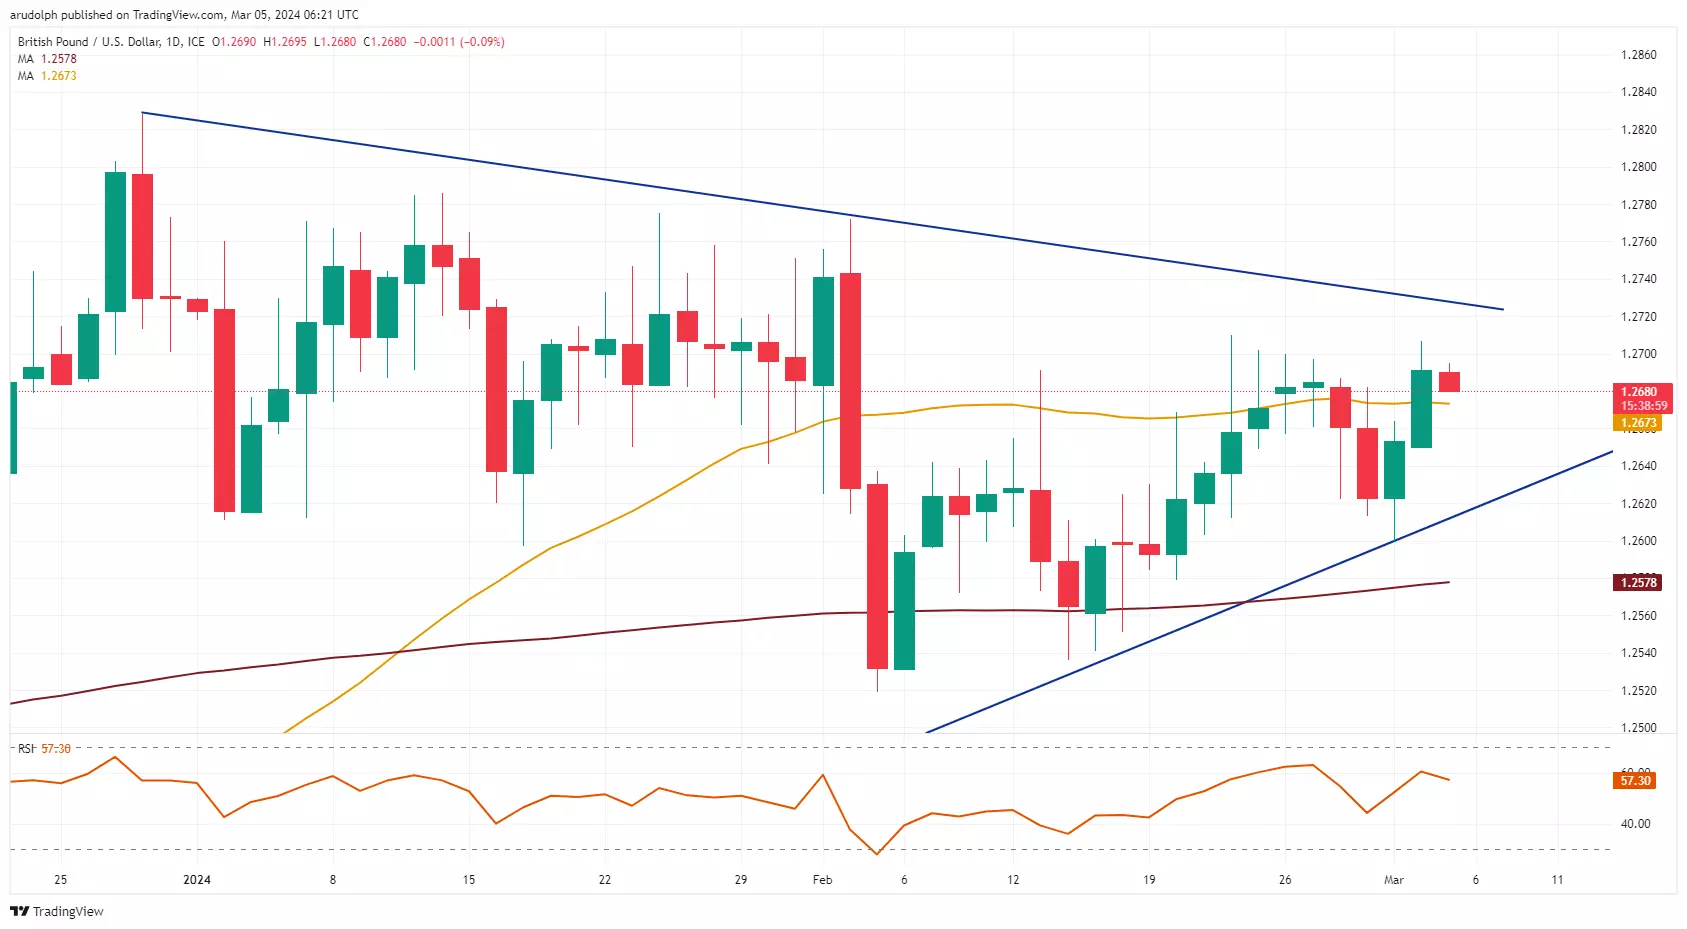
GBP/USD consolidates below resistance
GBP/USD recovered from Friday's low at $1.26 and risen to Monday's $1.2707 high, close to its $1.271 late February high which is still key. While the cross remains below these levels, further range trading is likely to be seen.
The $1.271 level needs to be overcome for the $1.275 area to be back in sight. This outlook will remain valid while Friday's low at $1.26 underpins.
Minor support below the 55-day simple moving average (SMA) at $1.2673 sits at the late January $1.2641 low ahead of the more significant $1.2612-11 support zone.
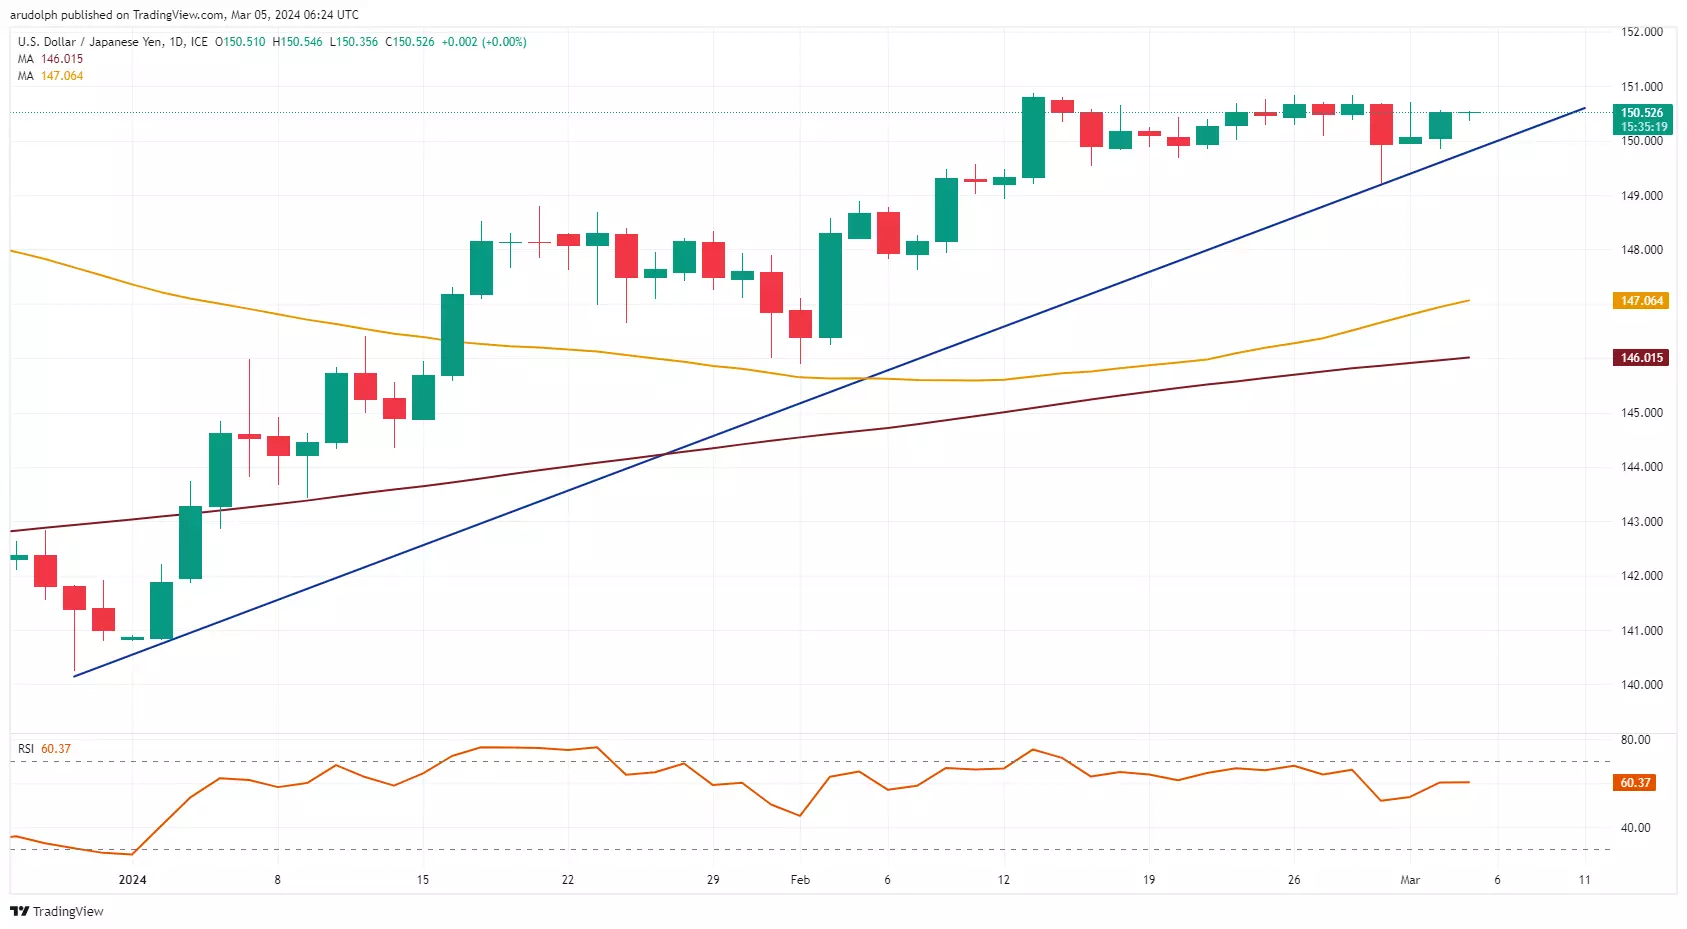
USD/JPY continues to gradually advance
Last week's USD/JPY rapid fall towards the ¥148.93-80 support zone, made up of the 19 and 23 January as well as 5 February highs and 12 February low, was followed by a gradual advance to Friday's ¥150.72 high. This remains in sight.
Above it lie the February highs at ¥150.83-88. While these levels cap, though, a toppish bearish reversal pattern may still unfold.
Minor support can be spotted at the 20 February ¥149.69 low.
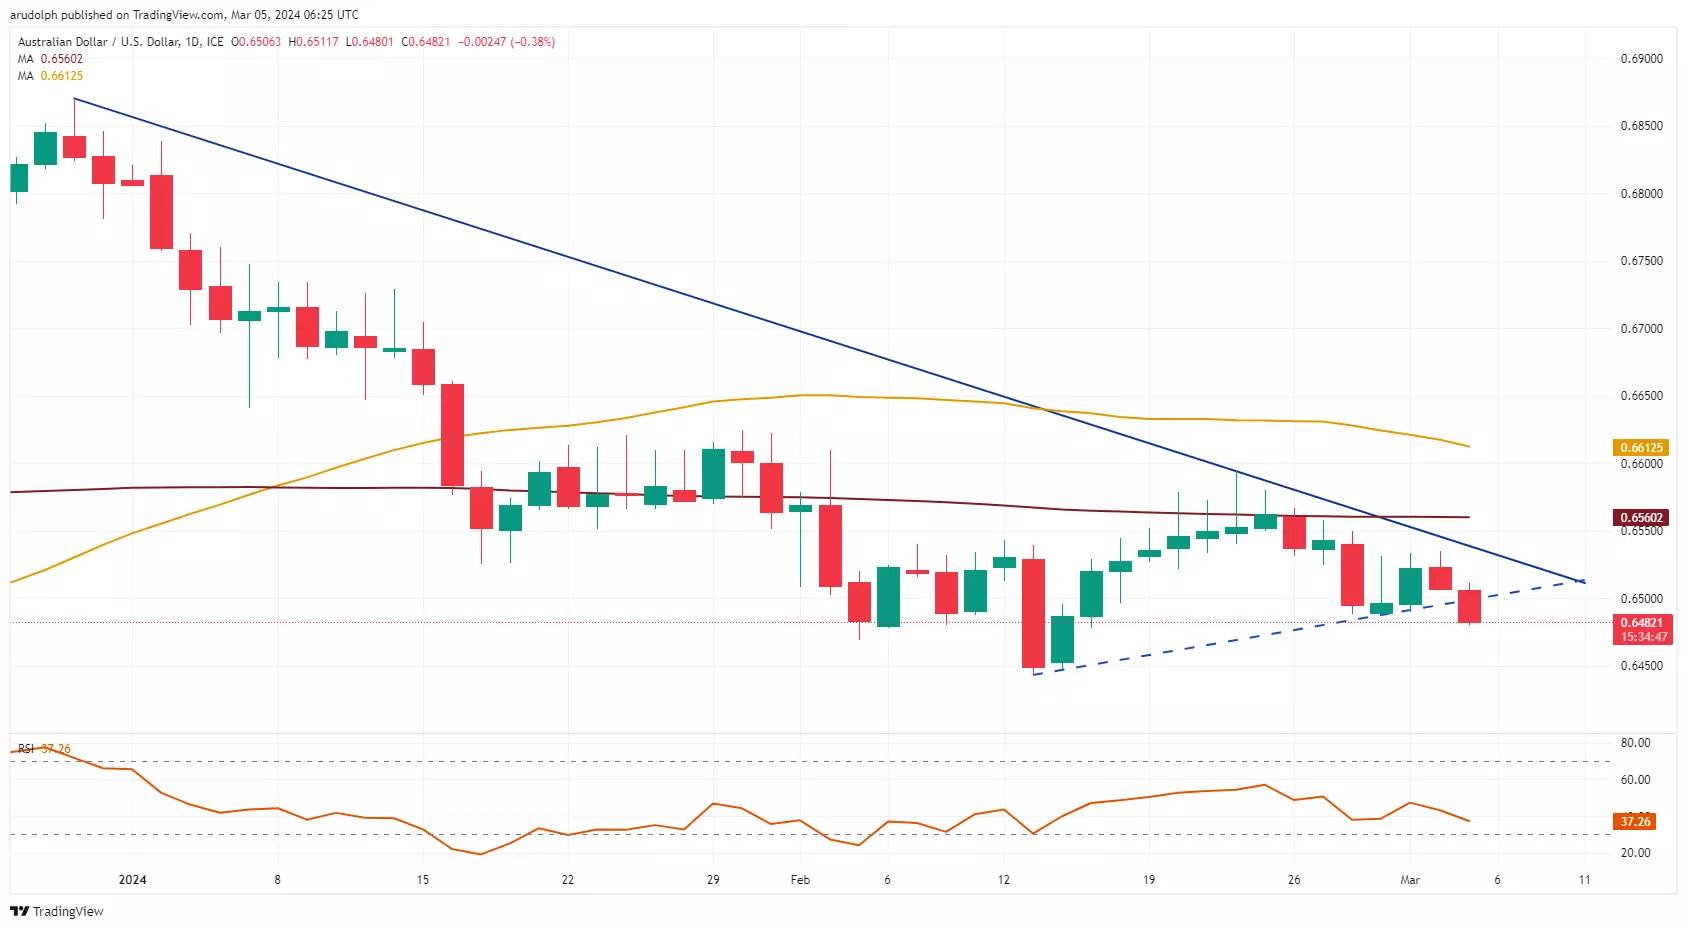
AUD/USD slips once more
Last week AUD/USD made a near two-week low at $0.6487 from which it recovered to Monday's $0.6535 high before it resumed its descent.
As long as the $0.6487-81 area underpins on a daily chart closing basis, though, the mid-February advance remains intact.
Failure at $0.6481 would push the 13 February low at $0.6443 to the fore.
This information has been prepared by IG, a trading name of IG Australia Pty Ltd. In addition to the disclaimer below, the material on this page does not contain a record of our trading prices, or an offer of, or solicitation for, a transaction in any financial instrument. IG accepts no responsibility for any use that may be made of these comments and for any consequences that result. No representation or warranty is given as to the accuracy or completeness of this information. Consequently any person acting on it does so entirely at their own risk. Any research provided does not have regard to the specific investment objectives, financial situation and needs of any specific person who may receive it. It has not been prepared in accordance with legal requirements designed to promote the independence of investment research and as such is considered to be a marketing communication. Although we are not specifically constrained from dealing ahead of our recommendations we do not seek to take advantage of them before they are provided to our clients.

Start trading forex today
Trade the largest and most volatile financial market in the world.
- Spreads start at just 0.6 points on EUR/USD
- Analyse market movements with our essential selection of charts
- Speculate from a range of platforms, including on mobile
Live prices on most popular markets
- Forex
- Shares
- Indices