US earnings preview: what to expect from NVIDIA results
For NVIDIA to sustain its lofty share price, it's imperative that the company's results meet Wall Street's expectations.


Key takeaways
- NVIDIA's fourth-quarter results for fiscal year 2024 will be reported on February 21, 2024.
- NVIDIA's stock has been performing well, with a significant increase of nearly 50% year to date. This growth is driven by the increasing demand for AI technology, and the company has received optimistic price target upgrades from institutions like Goldman Sachs and Bank of America.
- Analyst estimates for NVIDIA's Q4 2024 results suggest a total revenue of $20.322 billion, and earnings per share of $4.55.
- NVIDIA's shares are currently trading at a premium compared to the average price targets set by analysts. This implies that there is a risk of the stock price not meeting the high expectations set by the market.
- The average price target for NVIDIA, based on 38 Wall Street analysts, is $689.87.
When are the NVIDIA results expected?
NVIDIA, the Nasdaq listed technology giant will report results for the fourth quarter of fiscal 2024 (Q4 2024) on Wednesday the 21st of February 2024.
NVIDIA earnings preview, what does ‘The Street’ expect?
NVIDIA's stock has been on a meteoric rise, soaring nearly 50% year to date, as the company capitalizes on the burgeoning demand for AI technology.
Fueling this ascent, esteemed financial institutions such as Goldman Sachs and Bank of America have issued bullish price target upgrades, injecting a fresh wave of optimism among investors. This vote of confidence has been instrumental in driving the aggressive capital gains NVIDIA has enjoyed recently.
However, it's crucial to note that NVIDIA's shares (NVDA) are currently trading at a premium compared to the average of analysts' price targets. This sets the stage for a pivotal moment: the upcoming earnings results. For NVIDIA to sustain its lofty share price, it's imperative that the company's performance aligns with, or surpasses, Wall Street's high expectations.
A mean of analyst estimates from Refinitiv data arrives at the following expectations for the Q4 2024 results:
- Total revenue $20.322 billion
- Earnings per share $4.55
NVIDIA’s guidance for Q4 2024 (as per Q3 2024 results) is as follows:
- Revenue is expected to be $20.00 billion, plus or minus 2%.
- GAAP and non-GAAP gross margins are expected to be 74.5% and 75.5%, respectively, plus or minus 50 basis points.
- GAAP and non-GAAP operating expenses are expected to be approximately $3.17 billion and $2.20 billion, respectively.
- GAAP and non-GAAP other income and expense are expected to be an income of approximately $200 million, excluding gains and losses from non-affiliated investments.
GAAP and non-GAAP tax rates are expected to be 15.0%, plus or minus 1%, excluding any discrete items.
How to trade the NVIDIA results
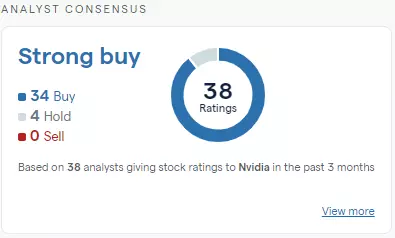
Based on 38 Wall Street analysts offering 12-month price targets for Nvidia in the last 3 months. The average price target is US$689.87 with a high forecast of US$1,100.00 and a low forecast of US$560.00. The average price target represents a -4.51% change from the last price of US$722.45.
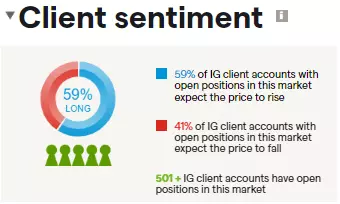
Fifty nine percent of IG clients with open positions on NVIDIA (as of the 14th of February 2024) expect the share price to rise in the near term, while forty one percent of IG clients with open positions on the company expect the price to fall.
NVIDIA: Technical view
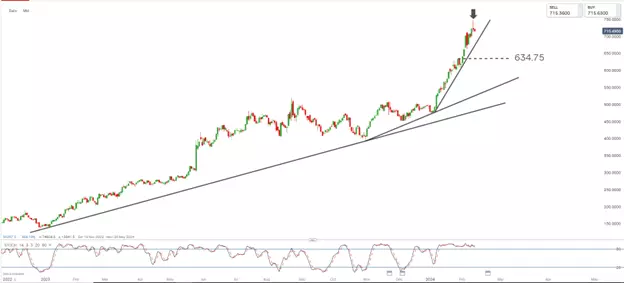
The share price of NVIDIA has been rising exponentially in 2024. The three steepening trend lines highlight what may be a price blowoff in technical analysis terms. A price blowoff suggests an uptrend which has become overheated in the near term. The black arrow marks a shooting star candle pattern which is considered a bearish intraday price reversal. The stock price also trades within overbought territory.
These indications suggest that the price could be setting up to either correct or consolidate. However, the long-term trend remains up and in lieu traders might prefer to use any short-term weakness (should it occur) as an opportunity to accumulate stock.
IGA, may distribute information/research produced by its respective foreign affiliates within the IG Group of companies pursuant to an arrangement under Regulation 32C of the Financial Advisers Regulations. Where the research is distributed in Singapore to a person who is not an Accredited Investor, Expert Investor or an Institutional Investor, IGA accepts legal responsibility for the contents of the report to such persons only to the extent required by law. Singapore recipients should contact IGA at 6390 5118 for matters arising from, or in connection with the information distributed.
The information/research herein is prepared by IG Asia Pte Ltd (IGA) and its foreign affiliated companies (collectively known as the IG Group) and is intended for general circulation only. It does not take into account the specific investment objectives, financial situation, or particular needs of any particular person. You should take into account your specific investment objectives, financial situation, and particular needs before making a commitment to trade, including seeking advice from an independent financial adviser regarding the suitability of the investment, under a separate engagement, as you deem fit.
No representation or warranty is given as to the accuracy or completeness of this information. Consequently, any person acting on it does so entirely at their own risk. Please see important Research Disclaimer.
Please also note that the information does not contain a record of our trading prices, or an offer of, or solicitation for, a transaction in any financial instrument. Any views and opinions expressed may be changed without an update.
Live prices on most popular markets
- Forex
- Shares
- Indices
See more forex live prices
See more shares live prices
Prices above are subject to our website terms and agreements. Prices are indicative only. All shares prices are delayed by at least 15 mins.
See more indices live prices
Prices above are subject to our website terms and agreements. Prices are indicative only. All shares prices are delayed by at least 20 mins.
