S&P 500 Momentum Report
With chatters that a market correction may be due following a strong rally since the start of the year, Wall Street did just that, with major US indices extending their losses for the second straight week.

Risk-off continues, with eyes on upcoming earnings to save the day
With chatters that a market correction may be due following a strong rally since the start of the year, Wall Street did just that, with major US indices extending their losses for the second straight week. A potential delay in Federal Reserve (Fed)’s rate cuts, simmering geopolitical tensions and mixed results from major US banks were tapped on as catalysts for some de-risking, although one may argue that as long as resilient economic conditions remain supportive of corporate earnings and the Fed’s next move is still a rate cut, the broader upward trend should persist.
Nevertheless, with the VIX at its highest level since November 2023, the risk environment remains challenged in the near term. US Treasury yields resumed their ascent overnight, paving the way for the US dollar to touch its five-month high. Ahead, eyes will be on upcoming earning releases to potentially take some attention away from tensions in the Middle East, along with Fed’s policy outlook.
What to watch: US earnings season
Mixed bank earnings to end last week were comforted with a stellar set of performance from Goldman Sachs into the new week, but recovery has not been broad-based across the sector. Ahead, results from Bank of America and Morgan Stanley (24 Hours) will be in focus to round up the key earnings for the sector. Netflix will also be the highlight this week, with market participants watching if its stellar subscriber growth in the previous earnings release can be mirrored in its upcoming results as well. Overall, expectations are for S&P 500’s 1Q earnings to grow 3.2% year-on-year (YoY), which will mark the third-straight quarter of earnings growth.
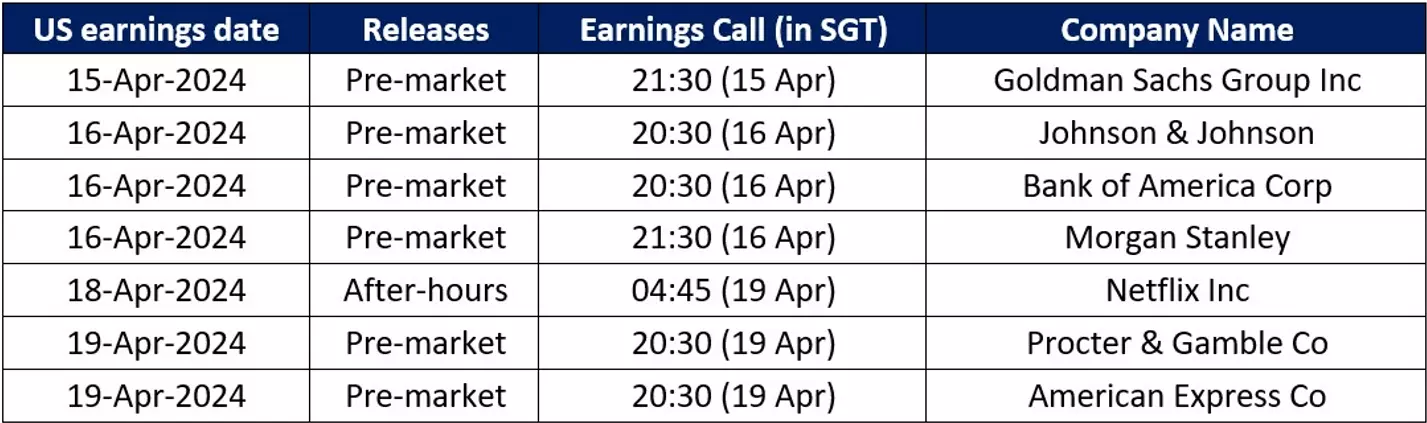
Source: Refinitiv
S&P 500 technical analysis: Psychological 5,000 level on watch
Following a breakdown of a near-term rising channel pattern, the S&P 500 saw further selling to a one-month low last week, with its daily relative strength index (RSI) trading below the key 50 level for the first time since November 2023 as a sign of sellers taking greater control. Its daily moving average convergence/divergence (MACD) is also eyeing for a bearish crossover into negative territory for the first time in five months.
Ahead, the key psychological 5,000 level will be on watch as the next support level to hold, where a 23.6% Fibonacci retracement level coincides with its daily Ichimoku Cloud support zone. On the upside, the 5,143 level will serve as immediate resistance to overcome. A look at near-term market breadth indicators (% of S&P 500 stocks above 50-day moving average (MA), 100-day MA, 200-day MA) suggests room for further de-risking to continue before touching oversold territory.
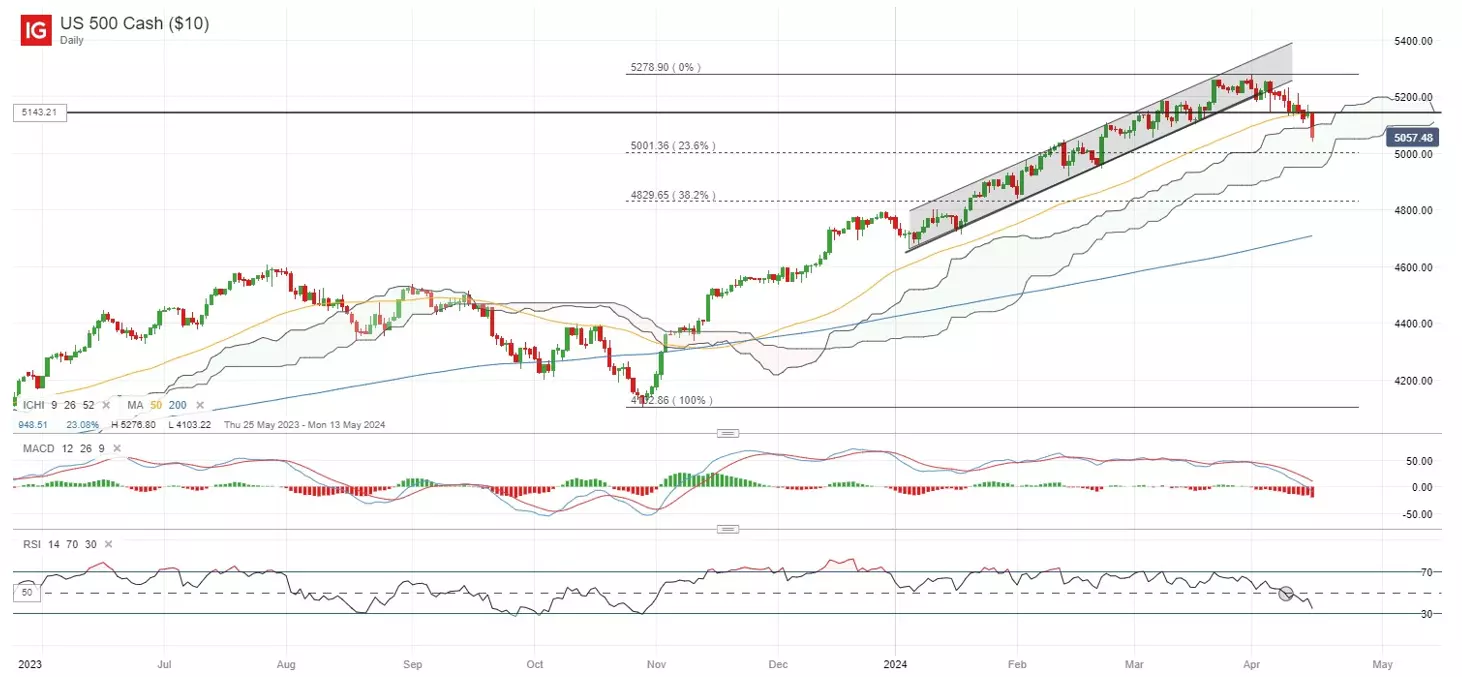
Source: IG charts
Nasdaq 100 technical analysis: Double-top formation breakdown?
After being stuck in consolidation over the past month, the Nasdaq 100 index has seemingly broken below the neckline of a near-term double-top formation, which suggests sellers taking on greater control for now. Its daily RSI has also failed to defend its key 50 level for the first time since January 2024, which points to a near-term bearish bias.
Ahead, the 17,400 level may be on watch as support confluence, where a 23.6% Fibonacci retracement level coincides with the lower edge of its Ichimoku Cloud support. Failure for the 17,400 level to hold may extend the retracement to the 17,000 level next. Similarly, a look at near-term market breadth indicators (% of Nasdaq 100 stocks above 50-day MA, 100-day MA, 200-day MA) suggests room for further de-risking to continue before touching oversold territory.
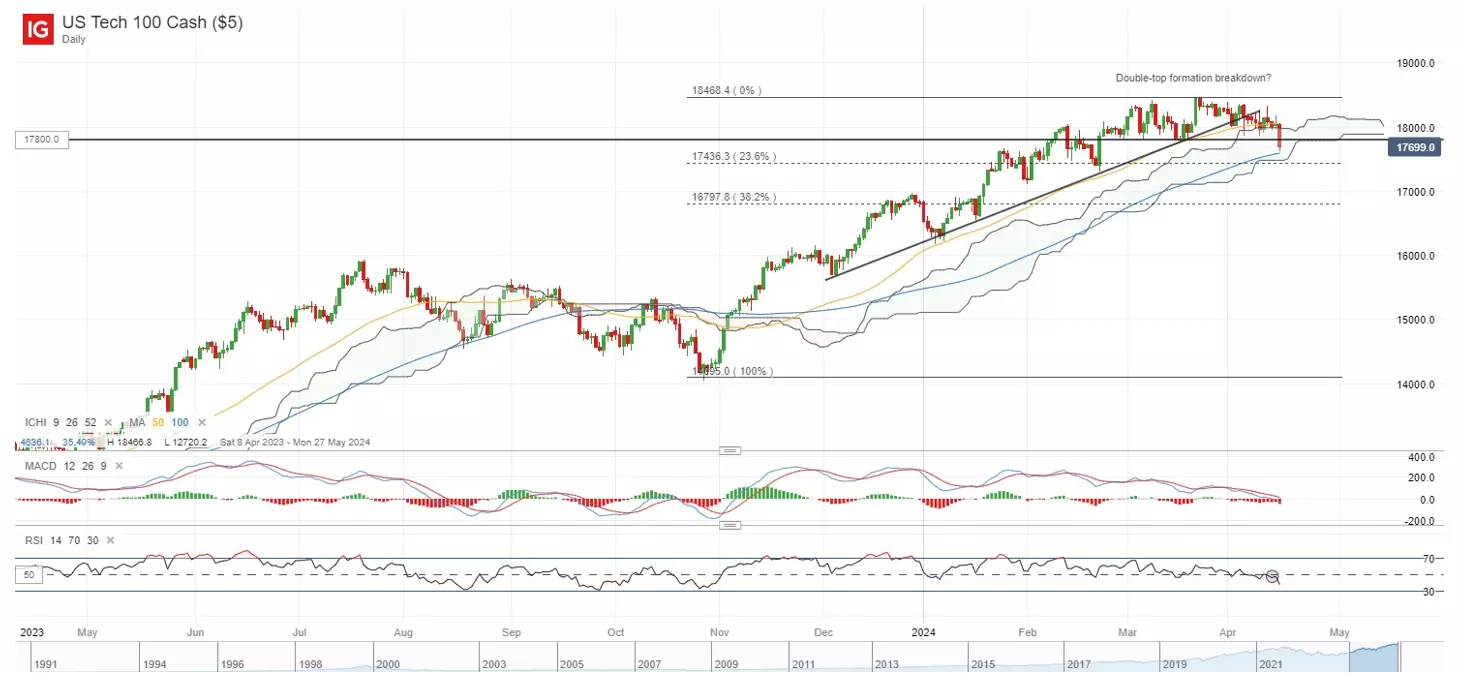
Source: IG charts
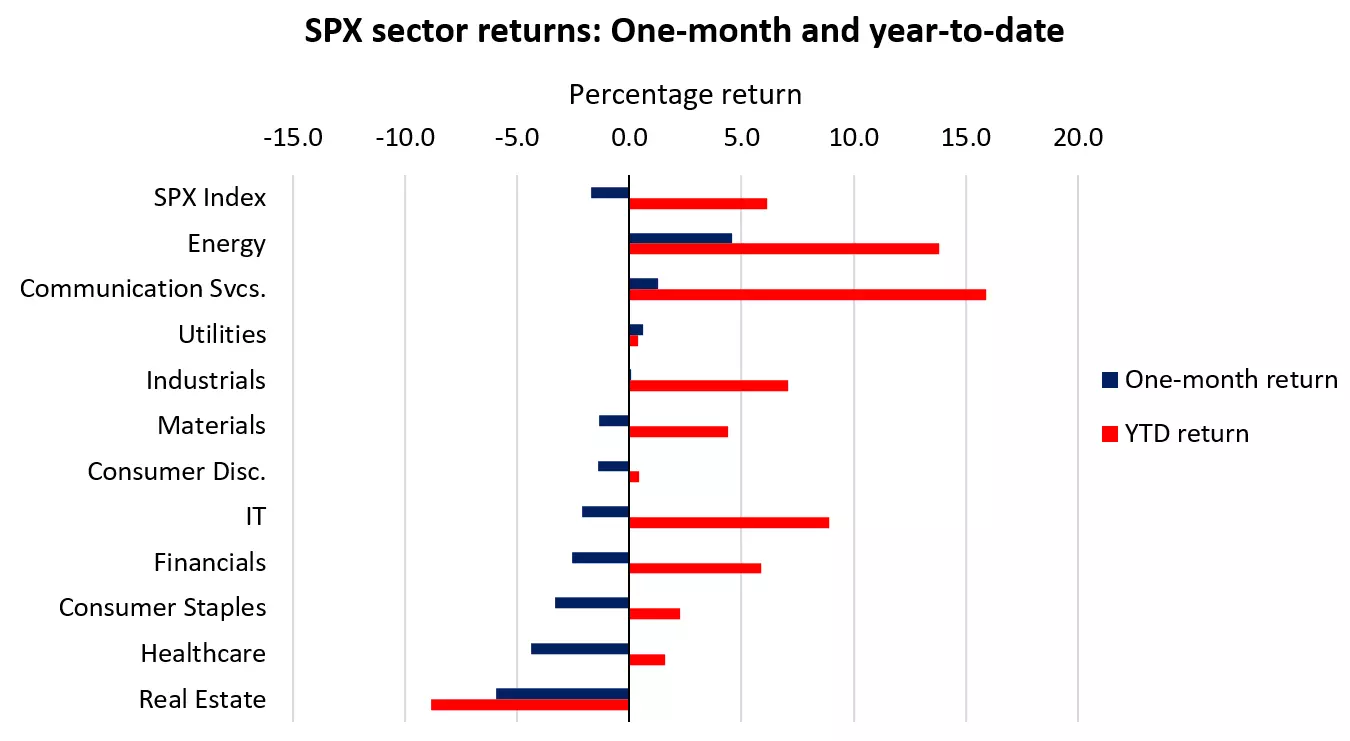
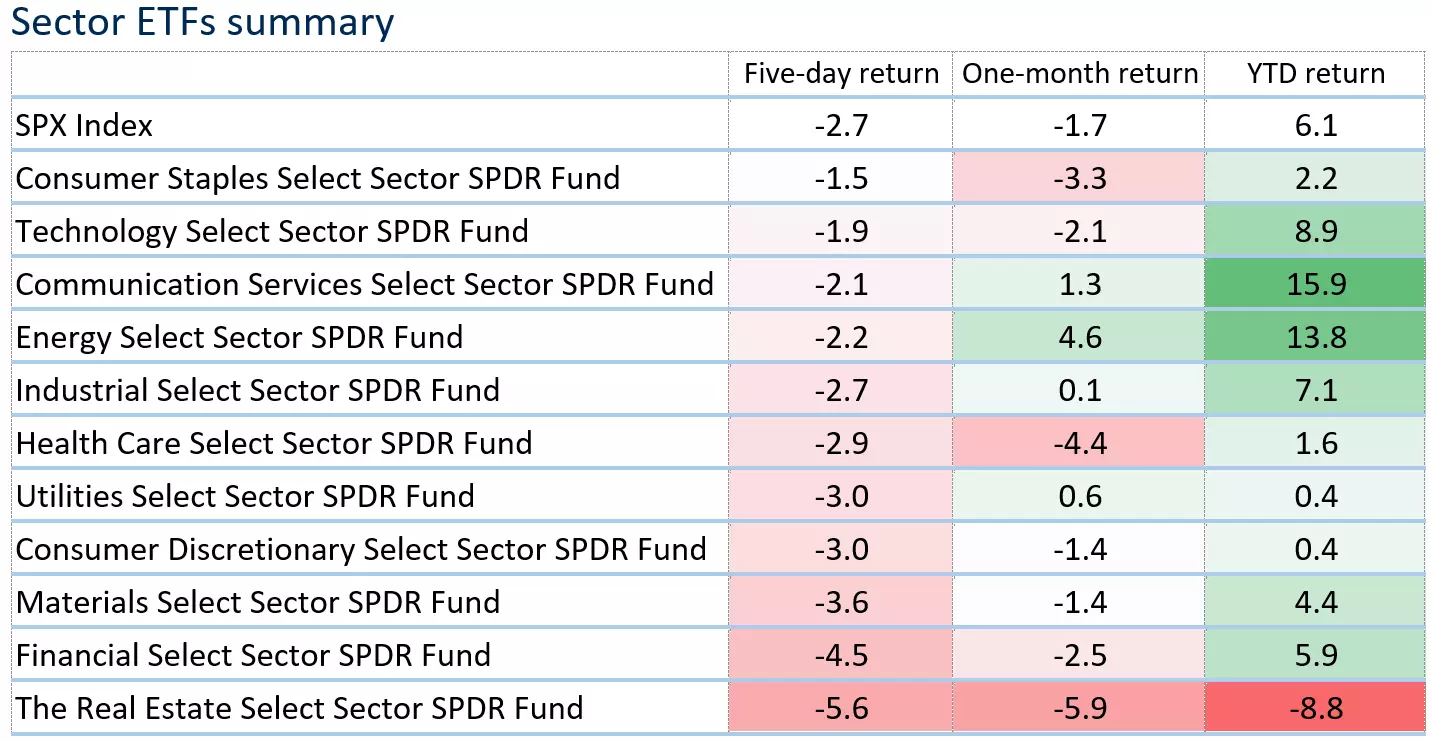
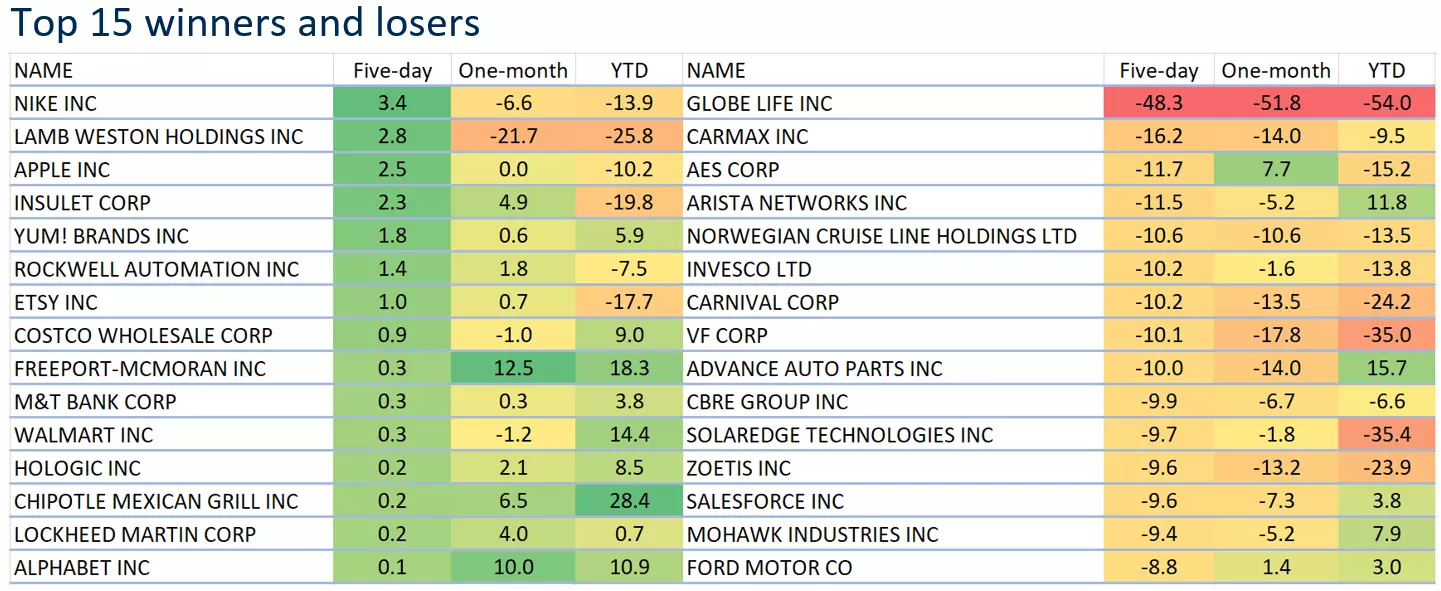
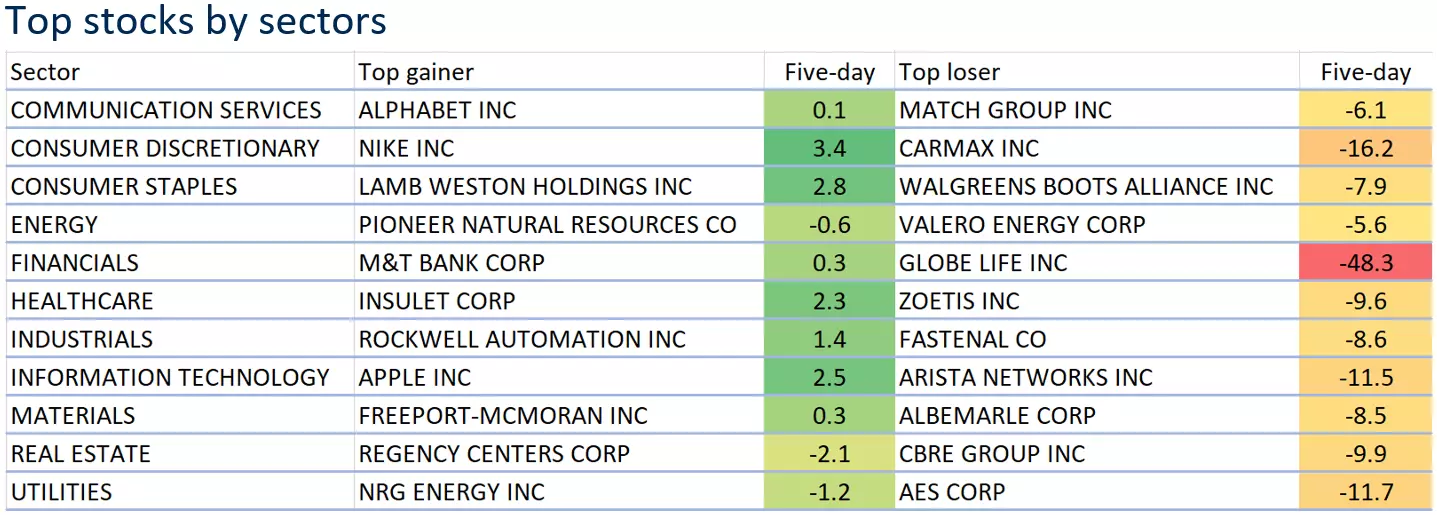
Sector performance
Last week was marked with broader risk-off moves across all S&P 500 sectors, with the index down 2.7%, as risk sentiments reeled in from a potential delay in Fed’s rate cuts, simmering geopolitical tensions and mixed results from major US banks. Relative resilience was seen in the consumer staples, technology and communication services sectors, while the real estate and financial sectors underperformed with a more than 4% dip for the week. Performance among the ‘Magnificent Seven’ stocks was mixed as well. Tesla extended its losses by 6.7% to touch its 11-month low, Meta was down 3.7% while Microsoft was down 2.6%. The only bright spot was Apple (+2.5%), but the near-term resilience may come off the back of its underperformance since the start of the year. The semiconductor industry also saw some unwinding, with AMD down 5.6% and Intel down 4.4%, while the industry leader, Nvidia, managed to hold up better with a 1.3% loss.
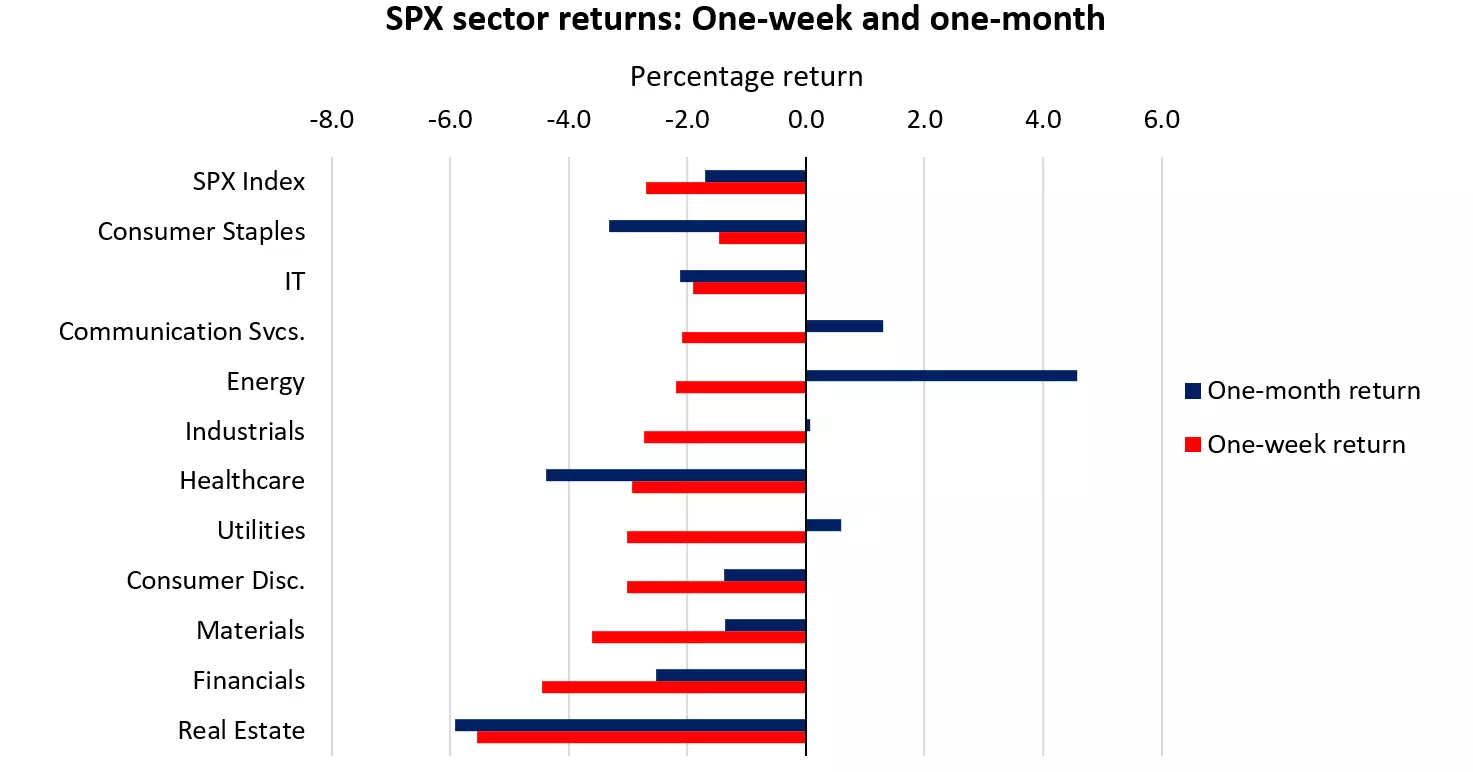
Source: Refinitiv
Source: Refinitiv
Source: Refinitiv
*Note: The data is from 9th – 15th April 2024.
Source: Refinitiv
*Note: The data is from 9th – 15th April 2024.
Source: Refinitiv
*Note: The data is from 9th – 15th April 2024.
IGA, may distribute information/research produced by its respective foreign affiliates within the IG Group of companies pursuant to an arrangement under Regulation 32C of the Financial Advisers Regulations. Where the research is distributed in Singapore to a person who is not an Accredited Investor, Expert Investor or an Institutional Investor, IGA accepts legal responsibility for the contents of the report to such persons only to the extent required by law. Singapore recipients should contact IGA at 6390 5118 for matters arising from, or in connection with the information distributed.
The information/research herein is prepared by IG Asia Pte Ltd (IGA) and its foreign affiliated companies (collectively known as the IG Group) and is intended for general circulation only. It does not take into account the specific investment objectives, financial situation, or particular needs of any particular person. You should take into account your specific investment objectives, financial situation, and particular needs before making a commitment to trade, including seeking advice from an independent financial adviser regarding the suitability of the investment, under a separate engagement, as you deem fit.
No representation or warranty is given as to the accuracy or completeness of this information. Consequently, any person acting on it does so entirely at their own risk. Please see important Research Disclaimer.
Please also note that the information does not contain a record of our trading prices, or an offer of, or solicitation for, a transaction in any financial instrument. Any views and opinions expressed may be changed without an update.

Seize a share opportunity today
Go long or short on thousands of international stocks.
- Increase your market exposure with leverage
- Get spreads from just 0.1% on major global shares
- Trade CFDs straight into order books with direct market access
Live prices on most popular markets
- Forex
- Shares
- Indices
See more forex live prices
See more shares live prices
Prices above are subject to our website terms and agreements. Prices are indicative only. All shares prices are delayed by at least 15 mins.
See more indices live prices
Prices above are subject to our website terms and agreements. Prices are indicative only. All shares prices are delayed by at least 20 mins.
