S&P 500 Momentum Report
The new trading week is met with some wait-and-see in Wall Street, as reservations kicked in ahead of the upcoming US CPI release, which will play a crucial role in driving market rate expectations.


Countdown to US CPI release this week to drive Fed’s rate expectations
The new trading week is met with some wait-and-see in Wall Street, as reservations kicked in ahead of the upcoming US consumer price index (CPI) release, which will play a crucial role in driving market rate expectations. Following a recent run of stronger-than-expected US economic data, the odds of a June rate cut has been walked back to be nothing more than a coin toss, but US equity markets have been taking it in stride, finding comfort in soft-landing views and an eventual policy easing from the Federal Reserve (Fed).
What to watch: US CPI
Earlier, US policymakers have revealed some tolerance for hotter-than-expected consumer prices over the past months, with Fed Chair Jerome Powell addressing the pricing persistence as a mere “bumpy ride” towards the Fed’s inflation target and still expect to lower rates “at some point this year.” While it may have to take much more for the Fed to reverse their easing stance, another set of hot inflation read this week may likely test the Fed’s tolerance once more, which could see market participants lean further towards having two rate cuts through 2024, as compared to the three cuts priced just a week ago.
Expectations are for US core inflation to ease slightly to 3.7% from previous 3.8%, while headline read may tick higher to 3.4% from previous 3.2%. Month-on-month, both headline and core consumer prices are expected to rise by 0.3%.
S&P 500 technical analysis: April low on watch
The S&P 500 has dipped below a near-term rising channel pattern, following a sell-off last week which seems to tap on escalating geopolitical tensions as a reason for some profit-taking. While some indecision is in place ahead of the upcoming US CPI release, the 4th April low at the 5,143 level will now be looked upon as immediate support to hold. Failure to do so may potentially trigger fresh selling pressures for the index to retest the 5,050 level next, where its daily Ichimoku Cloud may offer some support. For now, the upward trend in the index remains intact, with its daily relative strength index (RSI) still hovering above the key 50 level. On the upside, the recent April record high at the 5,278 level will serve as key resistance for buyers to overcome.
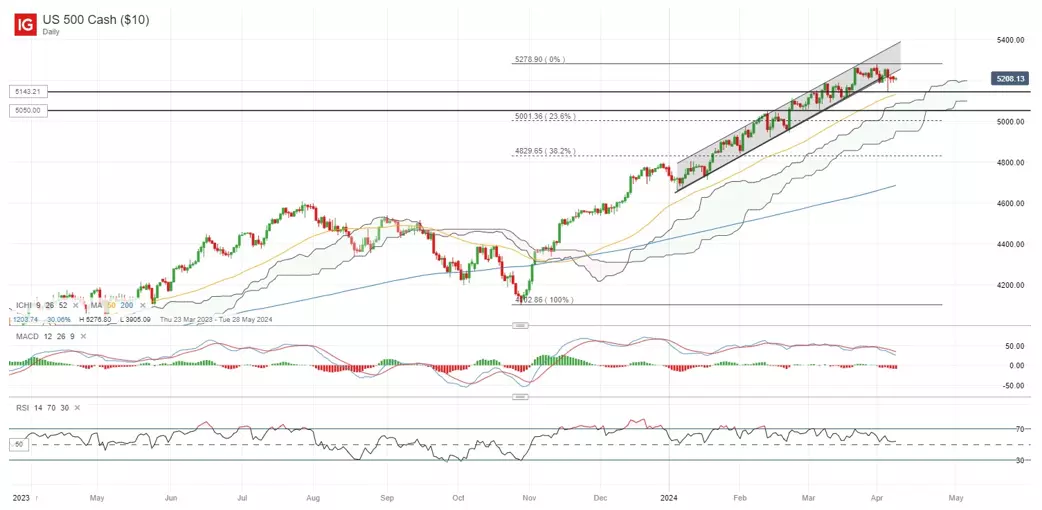
Source: IG charts
Nasdaq 100 technical analysis: Moment of reckoning ahead
Similarly, the Nasdaq 100 index has dipped below an upward trendline last week, with its daily RSI back to retest the key 50 level. Since November last year, the index has managed to stay above the RSI mid-point, which kept the upward bias intact. Its 4th April low at the 17,863 level will have to see some defending ahead as well, given that it coincides with its 50-day moving average (MA), where the index has not broken below the MA since November 2023. A breakdown of the trendline could signal sellers taking greater control, which may run the risks of a deeper retracement towards the 17,436 level.
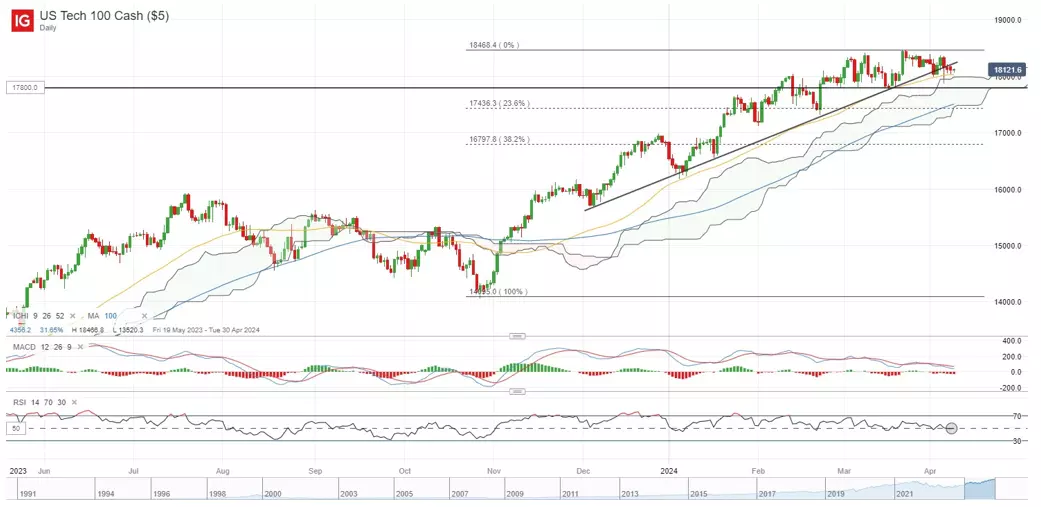
Source: IG charts
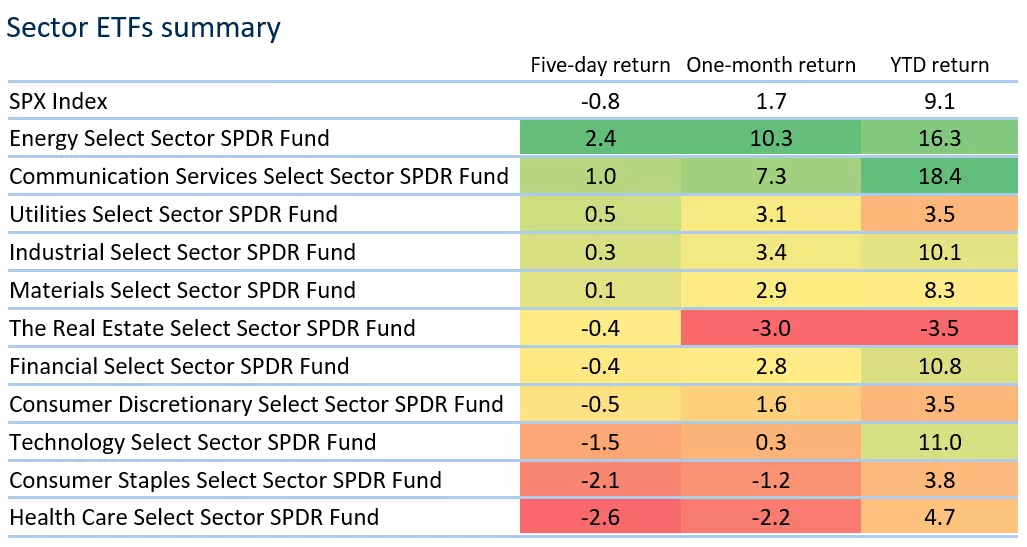
Sector performance
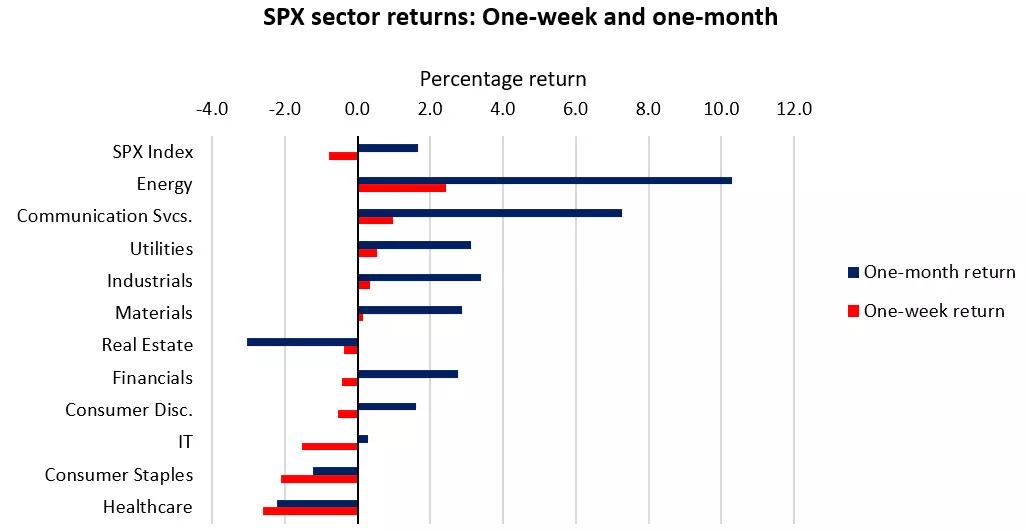
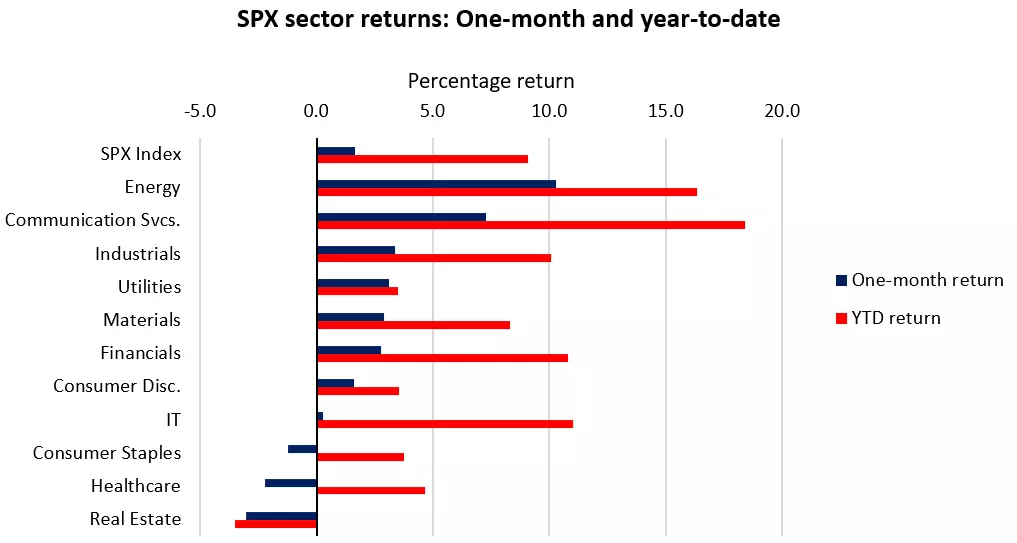
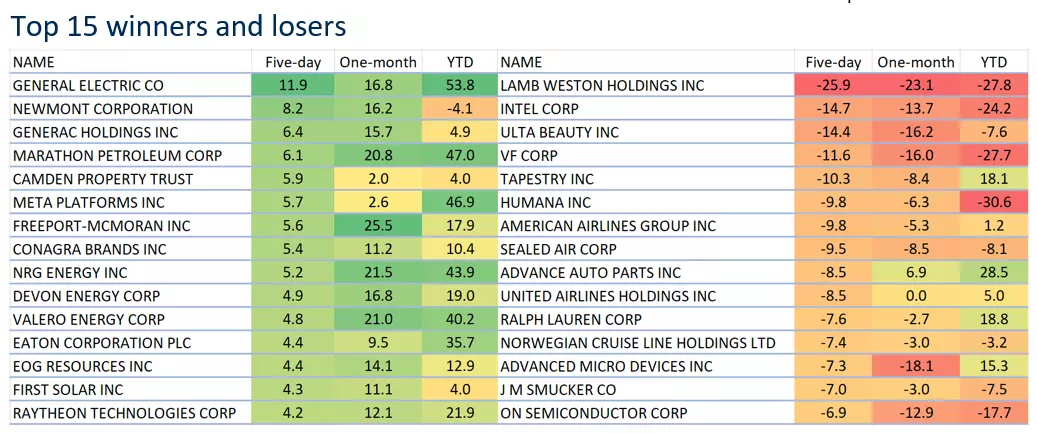
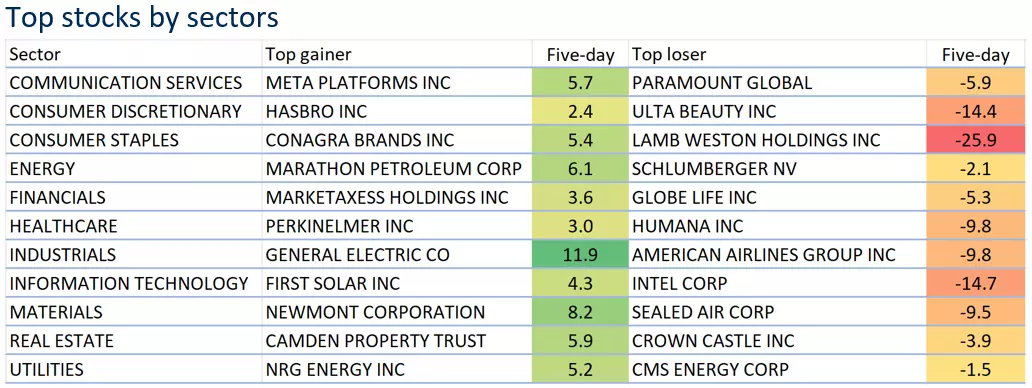
Performance across the S&P 500 sectors was mixed last week, with the broader index edging 0.8% lower as market participants reconsidered their rate expectations following a run of stronger-than-expected US economic data. Defensive sectors (consumer staples, healthcare) largely underperformed, which may still suggest some appetite for risk-taking. Growth sectors (technology, consumer discretionary) were dragged into the red as well, following a surge in Treasury yields. The US 10-year yields have touched its highest level since November 2023. The index constituents saw some profit-taking in semiconductors, particularly in Nvidia (-3.6%), AMD (-7.3%) and Intel (-14.7%). Among the “Magnificent Seven” stocks, Meta Platforms outshined its peers with a 5.7% gain, along with Amazon (+2.3%). Aside, the energy sector (+2.4%) came in as the top performing sector for the second straight week, riding on a five-month high in oil prices to scale to fresh record high territory.
Source: Refinitiv
Source: Refinitiv
Source: Refinitiv
*Note: The data is from 2nd – 8th April 2024.
Source: Refinitiv
*Note: The data is from 2nd – 8th April 2024.
Source: Refinitiv
*Note: The data is from 2nd – 8th April 2024.
IGA, may distribute information/research produced by its respective foreign affiliates within the IG Group of companies pursuant to an arrangement under Regulation 32C of the Financial Advisers Regulations. Where the research is distributed in Singapore to a person who is not an Accredited Investor, Expert Investor or an Institutional Investor, IGA accepts legal responsibility for the contents of the report to such persons only to the extent required by law. Singapore recipients should contact IGA at 6390 5118 for matters arising from, or in connection with the information distributed.
The information/research herein is prepared by IG Asia Pte Ltd (IGA) and its foreign affiliated companies (collectively known as the IG Group) and is intended for general circulation only. It does not take into account the specific investment objectives, financial situation, or particular needs of any particular person. You should take into account your specific investment objectives, financial situation, and particular needs before making a commitment to trade, including seeking advice from an independent financial adviser regarding the suitability of the investment, under a separate engagement, as you deem fit.
No representation or warranty is given as to the accuracy or completeness of this information. Consequently, any person acting on it does so entirely at their own risk. Please see important Research Disclaimer.
Please also note that the information does not contain a record of our trading prices, or an offer of, or solicitation for, a transaction in any financial instrument. Any views and opinions expressed may be changed without an update.

Seize a share opportunity today
Go long or short on thousands of international stocks.
- Increase your market exposure with leverage
- Get spreads from just 0.1% on major global shares
- Trade CFDs straight into order books with direct market access
Live prices on most popular markets
- Forex
- Shares
- Indices
See more forex live prices
See more shares live prices
Prices above are subject to our website terms and agreements. Prices are indicative only. All shares prices are delayed by at least 15 mins.
See more indices live prices
Prices above are subject to our website terms and agreements. Prices are indicative only. All shares prices are delayed by at least 20 mins.
