Q4 earnings season review – solid but unspectacular performance
Q4 earnings season is nearly done, and we look at the main trends arising from the reporting period for US stocks.


As the fourth quarter (Q4) 2023 earnings season drew to a close, S&P 500 companies delivered a performance that was satisfactory overall but fell short of historical averages in several key metrics. While profit growth remained positive, both the proportion of companies beating estimates and the magnitude of positive surprises lagged behind recent trends.
Slight drop in earnings beats
Overall, 73% of S&P 500 companies reported actual earnings per share (EPS) above analysts' mean estimates for Q4 2023. This percentage trails the 5-year average of 77% and the 10-year average of 74% for companies beating projections.
Tech stocks did well, while real estate struggled
At the sector level, there was a wide dispersion in the percentage of companies surpassing earnings expectations.
The Information Technology sector led the way, with an impressive 88% of companies reporting positive EPS surprises.
On the opposite end, only 55% of companies in the Real Estate sector topped EPS forecasts - the lowest across all sectors.
Size of earning & revenue surprises well below historical average
Not only were there fewer EPS beats, but the aggregate earnings surprise was also subdued compared to historical norms. In aggregate, S&P 500 companies reported earnings 4.1% above estimates - below the 5-year average of 8.5% and the 10-year average of 6.7%.
The revenue side of the equation showed a similar trend, with fewer companies beating top-line estimates and a muted surprise percentage compared to prior periods.
64% of S&P 500 companies reported actual revenues above estimates, short of the 5-year average of 68% (though in line with the 10-year average).
Collectively, companies reported revenues just 1.2% above expectations - lagging both the 5-year average of 2.0% and the 10-year average of 1.3%
Investors reward earnings surprises & forgive earnings misses
Despite the somewhat muted results, companies that managed to exceed earnings estimates were rewarded by investors more generously than historical averages would suggest.
Companies reporting positive EPS surprises saw their stock prices rise 1.4% on average surrounding the earnings release window. This exceeds the 5-year average price increase of 1.0% for companies beating bottom-line estimates. Conversely, negative earnings misses were punished less severely than usual, with those companies averaging a 1.0% stock price decline compared to the 5-year average of 2.3% for EPS misses.
Winners & Losers
While most sectors contributed positively to the overall earnings growth number, there were a few clear outperformers and underperformers in Q4, as seen in the chart below:
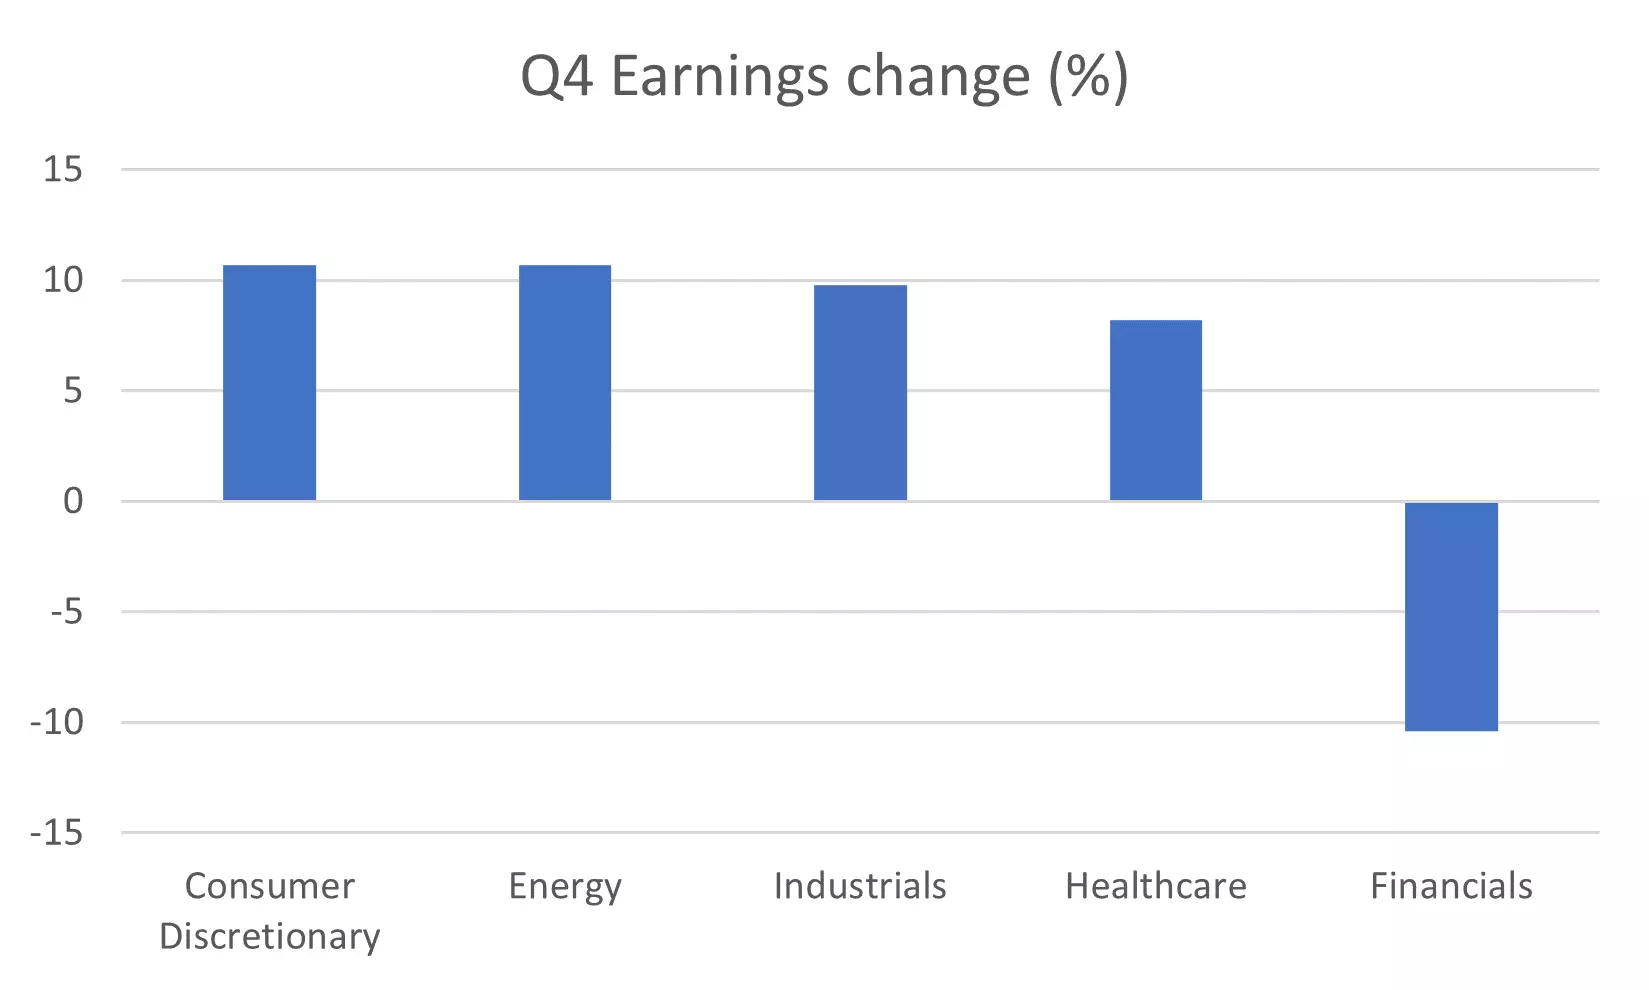
Big names like Ford, Marriott, Amazon, Marathon Petroleum and Valero Energy drove large positive surprises in consumer, energy and industrials. Healthcare was boosted by companies like Illumina, Moderna and Pfizer.
The financial sector stood out as a weak spot, with names like Citigroup, Truist and Comerica missing estimates due to impacts from FDIC assessments. This sector reported the largest aggregate negative earnings surprise.
Pace of profit growth slows
Despite the below-average metrics, S&P 500 earnings still grew year-over-year (YoY) for the second consecutive quarter. The blended earnings growth rate for Q4 2023 currently stands at 4.0%.
However, this growth rate is noticeably slower than prior quarters.
Analysts expect the deceleration to continue in Q1 2024 with projected earnings growth of just 3.6%, before potentially re-accelerating to 9.2% in Q2 2024 and 11.0% for full-year 2024.
Valuations still higher than average
The somewhat tepid earnings performance comes against the backdrop of relatively elevated stock valuations for the S&P 500. The forward 12-month price-to-earnings (P/E) ratio currently stands at 20.4 - well above both the 5-year average of 19.0 and the 10-year average of 17.7. This lofty valuation implies that investors remain optimistic about future earnings growth materialising.
Outlook for Q1 2024
As companies enter the Q1 2024 reporting period, they will need to clear a higher profitability bar to sustain current stock prices and valuations. While the Q4 earnings season kept the profit growth streak alive, the path ahead appears more challenging amid economic uncertainties.
IGA, may distribute information/research produced by its respective foreign affiliates within the IG Group of companies pursuant to an arrangement under Regulation 32C of the Financial Advisers Regulations. Where the research is distributed in Singapore to a person who is not an Accredited Investor, Expert Investor or an Institutional Investor, IGA accepts legal responsibility for the contents of the report to such persons only to the extent required by law. Singapore recipients should contact IGA at 6390 5118 for matters arising from, or in connection with the information distributed.
The information/research herein is prepared by IG Asia Pte Ltd (IGA) and its foreign affiliated companies (collectively known as the IG Group) and is intended for general circulation only. It does not take into account the specific investment objectives, financial situation, or particular needs of any particular person. You should take into account your specific investment objectives, financial situation, and particular needs before making a commitment to trade, including seeking advice from an independent financial adviser regarding the suitability of the investment, under a separate engagement, as you deem fit.
No representation or warranty is given as to the accuracy or completeness of this information. Consequently, any person acting on it does so entirely at their own risk. Please see important Research Disclaimer.
Please also note that the information does not contain a record of our trading prices, or an offer of, or solicitation for, a transaction in any financial instrument. Any views and opinions expressed may be changed without an update.

Seize a share opportunity today
Go long or short on thousands of international stocks.
- Increase your market exposure with leverage
- Get spreads from just 0.1% on major global shares
- Trade CFDs straight into order books with direct market access
Live prices on most popular markets
- Forex
- Shares
- Indices
See more forex live prices
See more shares live prices
Prices above are subject to our website terms and agreements. Prices are indicative only. All shares prices are delayed by at least 15 mins.
See more indices live prices
Prices above are subject to our website terms and agreements. Prices are indicative only. All shares prices are delayed by at least 20 mins.
