Nvidia share price: Q3 earnings preview
Nvidia’s share price has surged by close to 134% year-to-date. Can it continue to go higher?

When does Nvidia report earnings?
NVIDIA is set to release its quarter three (Q3) financial results on 17 November 2021, after market close.
Nvidia earnings – what to expect
Expectations for its upcoming Q3 results are for revenue to come in at $6.8 billion, up 43.9% from a year earlier and up 4.5% from the previous quarter. On another note, its earnings per share (EPS) is expected to come in at $1.11, up 84% from a year ago.
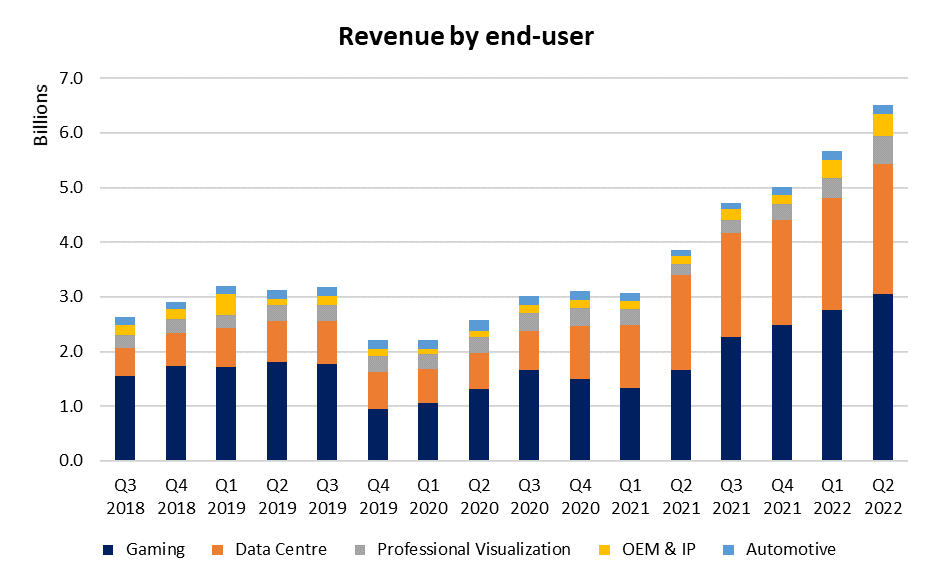
Nvidia has been seeing strong sales momentum since quarter two (Q2) 2021, lifted by growth across all its business segments as the Covid-19 pandemic accelerates the adoption of digital transformation. The upcoming results may remain supported by its key segments, namely gaming and data centres, which have seen record-breaking revenues in the last quarter.
For data centres, the shift from central processing units (CPUs) to graphics processing units (GPUs) to handle artificial intelligence (AI) workloads and deep learning is likely to continue. Microsoft Azure has also announced general availability in June, underpinning demand for its A100 GPUs. The gaming segment may also carry a wide addressable market to tap on, with 80% of the world’s personal computer (PC) gaming market yet to upgrade to Nvidia RTX. The near-term risk will come in terms of supply constraints, which may limit the production capacity to meet demand.
Its gross profit margins have remained resilient above 66% in the previous quarter, revealing some pricing power by catering for higher-end performance products with little substitutes. The margins are expected to improve further to 67% for the upcoming quarter, as guided by management previously.
Its Arm acquisition will remain a tailwind, being widely accretive in terms of cost savings and overall addressable market. Discussions with regulators are still ongoing, though the management has previously acknowledged that the deal is unlikely to be completed before the initial deadline of March 2022. Any positive surprise pertaining to the acquisition progress in the upcoming earnings call may be a catalyst to boost share price ahead.
During the recent Graphics Technology Conference (GTC) 2021, several key growth drivers have been revealed by Nvidia, reflecting its future foothold in the industry. Initiatives ranging from Omniverse expansions, quantum computing, enterprise AI and advancements in automotive and healthcare paint a wide scope of growth strategies for Nvidia to tap on. While these initiatives may not be reflected in the upcoming results, any guidance by management in those aspects will surely be welcomed by markets.
Nvidia’s valuation
Nvidia’s current forward price-earnings (P/E) ratio currently stands at 70.8, which is trading three standard deviations above its one-year mean. This is also higher than its peers, with AMD's forward P/E coming in at 47.6. Therefore, markets have been pricing in high growth expectations and its upcoming results may be expected to deliver on all fronts, including an upward revision to prior guidance to the likes of AMD.
Some competitive edge is also being priced as Nvidia continues to dominate the discrete GPU space with an 83% market share as of Q2 2021. This marks a continued gain in market share, compared to the previous quarter.
Currently, the stock has 38 ‘buy’ recommendations, six ‘holds’ and two ‘sells’. The last closing price of $306.57 is trading above the Bloomberg 12-month consensus target price of $241.42, bringing focus to the upcoming Q3 results to induce any price upgrades from analysts.
Nvidia shares – technical analysis
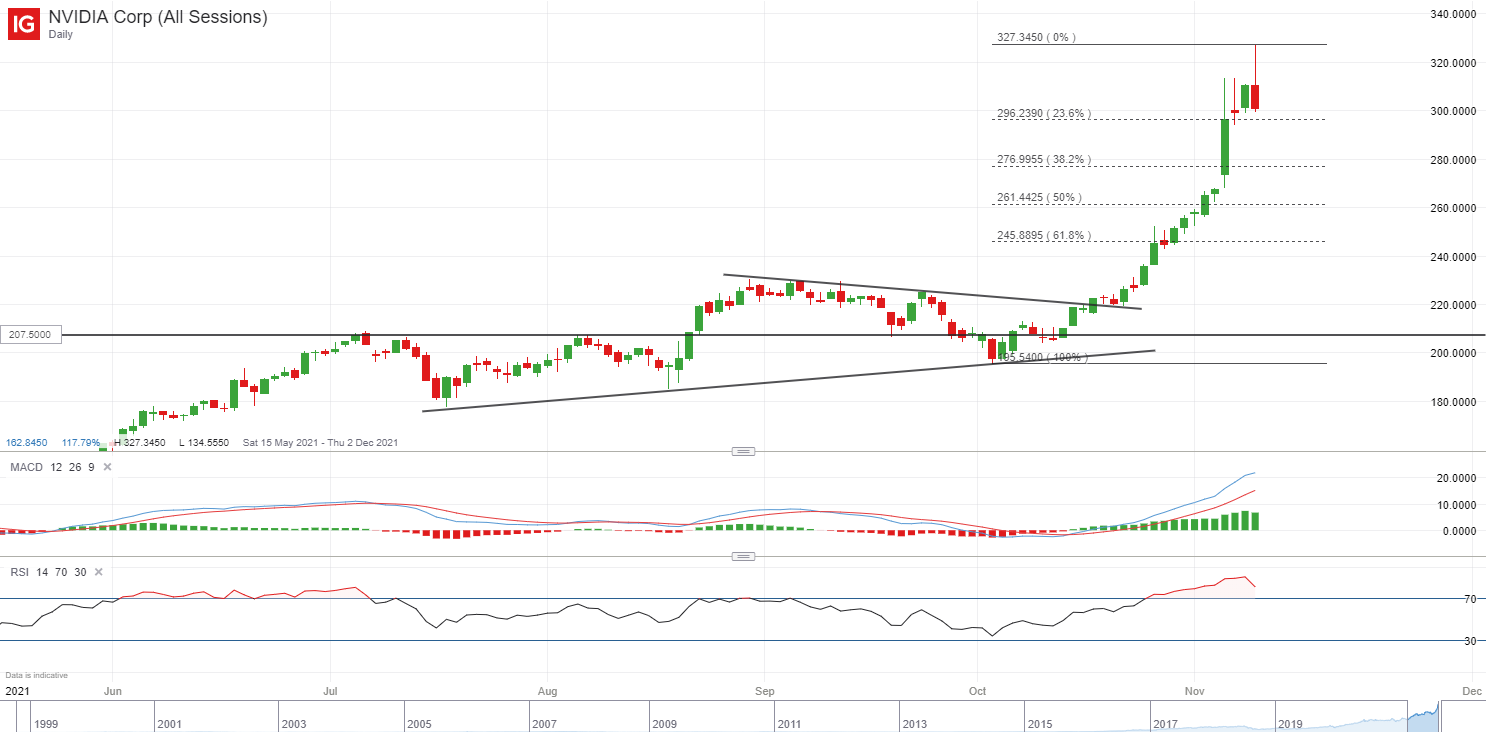
An upward break above a wedge pattern in mid-October saw a surge to its new record high at $327.35. That said, technical indicators are currently reflecting overextended levels, with the relative strength index (RSI) well into overbought region and the moving average convergence/divergence (MACD) at its highest level in five years.
All this may increase the chances of a near-term pullback, by drawing some profit-taking for short-term traders. If that occurs, near-term support to watch may be at the $296.24-$300.00 zone, where the Fibonacci 23.6% retracement level from its October’s bottom may come into play.
IGA, may distribute information/research produced by its respective foreign affiliates within the IG Group of companies pursuant to an arrangement under Regulation 32C of the Financial Advisers Regulations. Where the research is distributed in Singapore to a person who is not an Accredited Investor, Expert Investor or an Institutional Investor, IGA accepts legal responsibility for the contents of the report to such persons only to the extent required by law. Singapore recipients should contact IGA at 6390 5118 for matters arising from, or in connection with the information distributed.
The information/research herein is prepared by IG Asia Pte Ltd (IGA) and its foreign affiliated companies (collectively known as the IG Group) and is intended for general circulation only. It does not take into account the specific investment objectives, financial situation, or particular needs of any particular person. You should take into account your specific investment objectives, financial situation, and particular needs before making a commitment to trade, including seeking advice from an independent financial adviser regarding the suitability of the investment, under a separate engagement, as you deem fit.
No representation or warranty is given as to the accuracy or completeness of this information. Consequently, any person acting on it does so entirely at their own risk. Please see important Research Disclaimer.
Please also note that the information does not contain a record of our trading prices, or an offer of, or solicitation for, a transaction in any financial instrument. Any views and opinions expressed may be changed without an update.

Seize a share opportunity today
Go long or short on thousands of international stocks.
- Increase your market exposure with leverage
- Get spreads from just 0.1% on major global shares
- Trade CFDs straight into order books with direct market access
Live prices on most popular markets
- Forex
- Shares
- Indices
See more forex live prices
See more shares live prices
Prices above are subject to our website terms and agreements. Prices are indicative only. All shares prices are delayed by at least 15 mins.
See more indices live prices
Prices above are subject to our website terms and agreements. Prices are indicative only. All shares prices are delayed by at least 20 mins.
