Nasdaq100 Index midyear 2023 review and outlook
The Nasdaq100 has led global equity markets higher in the first half of 2023, but what happens next for technology heavy US index?


Nasdaq 100 outperforming in 2023
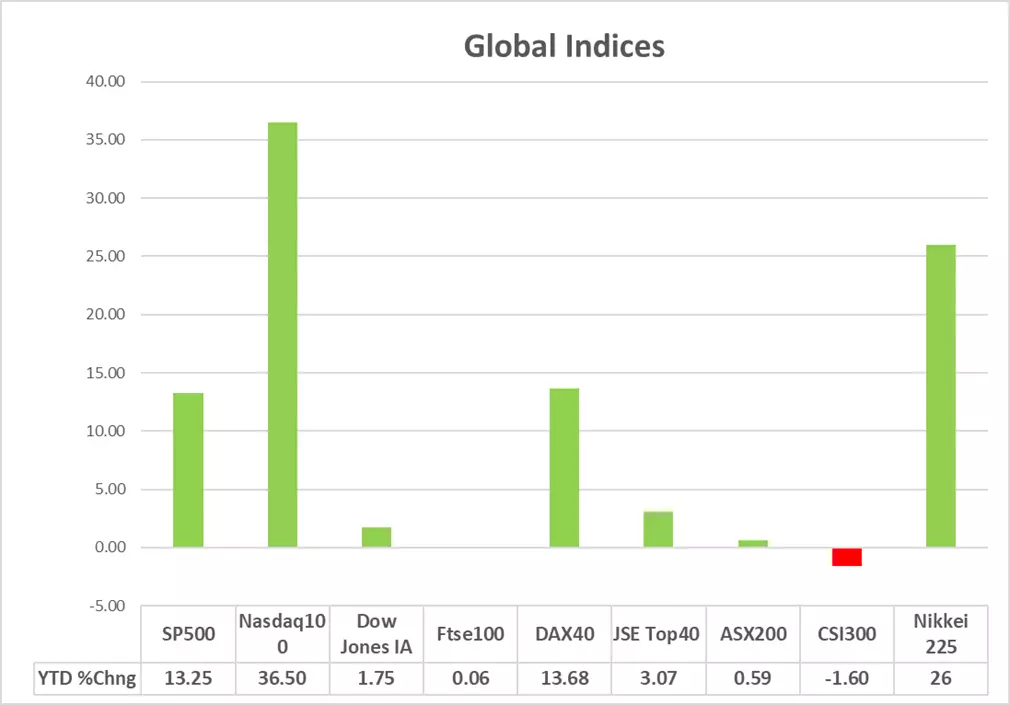
After a year of underperformance in 2022, Nasdaq100 gains in in 2023 (albeit off a lower base) have dwarfed that of global equity index peers (excluding the Nikkei).
As of the 26th of June 2023, the Nasdaq100 had added more than 35% year to date, with only gains in the Nikkei (+26%) tracking similar in size.
Why is the Nasdaq 100 trading higher in 2023?
The Nasdaq’s return to favour in 2023 has been swift. Initial gains might have been attributed to a perceived value in the index after its stark relative underperformance in 2022. This would have found some increased appeal through sector rotation out of index peers the SP500 and Dow Jones Industrial Average which carry exposure to what has been a worrisome US banking sector this year.
The Nasdaq 100 contains zero exposure to the US financial sector and roughly 60% exposure to the technology sector. Gains have then been further exacerbated by enthusiasm in cloud computing and hype around artificial intelligence (AI). These technology-driven industries are poised to transform the way we live and work, and investors are keen to be a part of this revolution. As such, companies like Amazon (AMZN), Alphabet (GOOGL), and Microsoft (MSFT) which provide major weightings to the Nasdaq have seen their stock prices soar, contributing to the index's stellar performance.
Broader equity market gains have also found a catalyst in the suggestion that inflation has started to turn the corner and that rates could be nearing the top of their current cycle, and at the very least not become too much more restrictive than they are right now.
Which companies are leading gains on the Nasdaq 100?
The market breadth for the Nasdaq 100 has been supportive with 77 of the 101 (in you include both (Alphabet listings) constituents trading in positive territory for the year to date.
Top gainers on the index for 2023 include Nvidia (+188%), Meta Platforms (Facebook) (+139%) and Tesla (+108%).
Is the Nasdaq 100 a buy at current levels?
The index currently pirouettes on a historical price-to-earnings (P/E) ratio of around 35 times, a valuation that treads closer to the last decade's high (41 times) than the decade low (15.8). This suggests that the Nasdaq 100 is relatively expensive at current levels, making some traders hesitate to jump into the fray.
Yet, it is essential to remember that the underlying earnings of major Nasdaq 100 constituents, like Apple Inc. (AAPL) and Amazon.com Inc. (AMZN), have started to rise. High valuations on growth-oriented companies are common, especially when they are driven by powerful forces like artificial intelligence (AI) and cloud computing. These technological themes are firmly in favor right now, supporting the appetite for investment in the index.
However, short-term gains have accelerated to a point where a healthy correction may be on the horizon. Investors and traders might prefer to bide their time, waiting for an opportunity to buy into a correction of the longer-term uptrend (should it occur).
Nasdaq100 – Midyear technical outlook
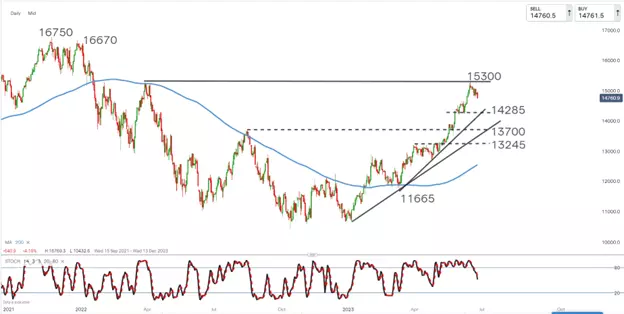
The Nasdaq100 has started to pullback from the 15300-resistance level and overbought territory. The short term move lower suggests a correction of the longer-term uptrend which remains in place as we see the price still trading firmly above the 200-day simple moving average (blue line) (200MA).
Trend followers might wait to see the short-term correction play out before looking for long entry. Long entry might be considered on a bullish price reversal closer to one of the labelled support levels (14285 initially) on the chart above.
A retest of the 15300-resistance level is favoured as we move further into the year. A break above this level (confirmed with a close above) could start paving the way for the index to start moving back towards the highs considered between levels 16670 and 16750 respectively.
Only on a move below the 200MA would we reassess the currently assumed long term upward trend bias for the index.
IGA, may distribute information/research produced by its respective foreign affiliates within the IG Group of companies pursuant to an arrangement under Regulation 32C of the Financial Advisers Regulations. Where the research is distributed in Singapore to a person who is not an Accredited Investor, Expert Investor or an Institutional Investor, IGA accepts legal responsibility for the contents of the report to such persons only to the extent required by law. Singapore recipients should contact IGA at 6390 5118 for matters arising from, or in connection with the information distributed.
The information/research herein is prepared by IG Asia Pte Ltd (IGA) and its foreign affiliated companies (collectively known as the IG Group) and is intended for general circulation only. It does not take into account the specific investment objectives, financial situation, or particular needs of any particular person. You should take into account your specific investment objectives, financial situation, and particular needs before making a commitment to trade, including seeking advice from an independent financial adviser regarding the suitability of the investment, under a separate engagement, as you deem fit.
No representation or warranty is given as to the accuracy or completeness of this information. Consequently, any person acting on it does so entirely at their own risk. Please see important Research Disclaimer.
Please also note that the information does not contain a record of our trading prices, or an offer of, or solicitation for, a transaction in any financial instrument. Any views and opinions expressed may be changed without an update.
Live prices on most popular markets
- Forex
- Shares
- Indices
See more forex live prices
See more shares live prices
Prices above are subject to our website terms and agreements. Prices are indicative only. All shares prices are delayed by at least 15 mins.
See more indices live prices
Prices above are subject to our website terms and agreements. Prices are indicative only. All shares prices are delayed by at least 20 mins.
