Microsoft Q3 earnings preview: OpenAI elevates tech ambitions
Microsoft's groundbreaking partnership with OpenAI heralds a new era of AI advancements, countering device revenue declines and stock variances with robust investor confidence and strategic AI integration.


When will Microsoft report its latest earnings?
Microsoft Corporation is scheduled to report its third quarter (Q3) earnings after the market closes on Friday, 26 April at 4.05am SGT (GMT +8).
Forecast bright for Microsoft's Intelligent Cloud in Q3
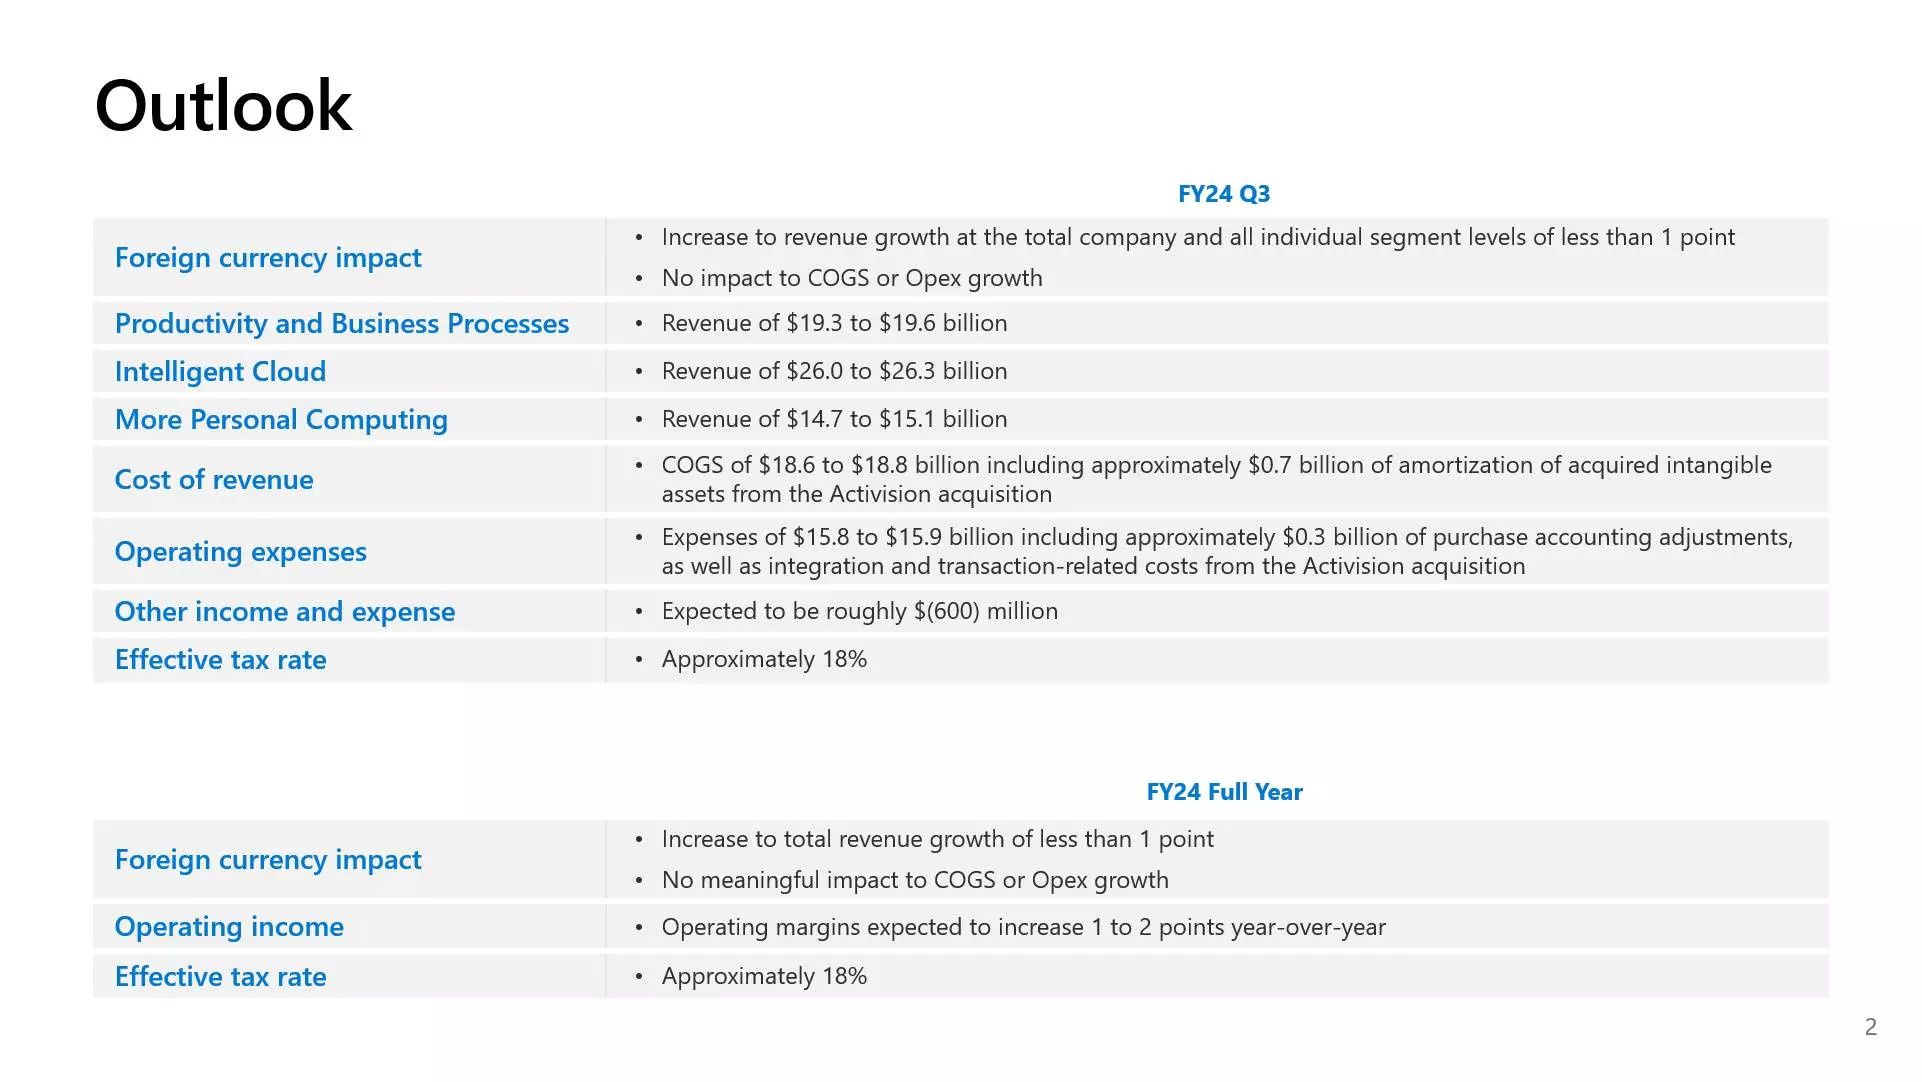
As demonstrated in Microsoft's recent reports, cloud services remain the crown jewel, driving 'Intelligent Cloud' revenue to $25.88 billion in Q2, up 20% year-over-year, and contributing to more than 40% of the group's total revenue. This momentum is expected to continue in Q3 as Microsoft projects revenue from this segment to grow to $26–$26.3 billion,
Microsoft's Q3 unpacked: slower revenues but stronger EPS
Revenue growth slows down
- Current Quarter (Q3 2023): $60.86 billion (expected)
- Previous Quarter (Q2 2023): $61.13 billion
EPS shows improvement
- Estimated EPS Q3 2023: $2.84
- EPS Q2 2023: $2.77
Year-over-year performance
- Q3 2023 revenue growth (year-over-year): 19% (expected)
- Q3 2023 EPS growth (year-over-year): 27% (estimated)
Microsoft's fiscal outlook for Q3 2024
Microsoft is preparing for modest yet strategic growth in the upcoming fiscal year 2024 Q3. Investors and stakeholders might anticipate a marginal uplift of less than 1 percentage point across all operational segments, with no significant alterations to the existing cost framework. This aims to maintain stable operational expenses and the cost of goods sold (COGS).
Detailed financial projections
- Revenue: predicted to range from $19.3 billion to $19.6 billion.
- Cost of Goods Sold (COGS): foreseen to fall between $18.6 billion and $18.8 billion. This includes an estimated $0.7 billion in amortisation expenses tied to the acquisition of intangible assets from Activision.
- Operating expenses: anticipated to be in the vicinity of $15.8 billion to $15.9 billion. This price encompasses costs associated with purchase accounting adjustments amounting to approximately $0.3 billion and costs accruing from the integration and transaction expenses related to the Activision acquisition.
Forging the future: Microsoft and OpenAI's groundbreaking partnership
Microsoft's cloud sector is currently its most shining asset, but the buzz and anticipation mainly circle around its upcoming advancements in artificial intelligence (AI). As the most highly valued corporation globally, Microsoft's strides in AI are under intense observation.
Following its substantial investment in OpenAI, Microsoft has strategically focused on weaving AI capabilities throughout its technological ecosystem. With ChatGPT rapidly becoming well-known, investors with a bullish outlook are keenly awaiting Microsoft's further integration of AI and future strategic initiatives that leverage its forefront position in the AI domain.
Microsoft's response to declining revenues
On the other side, a notable underperformance in Microsoft's portfolio is observed in the revenues from its devices and Office commercial products, which saw declines of 9% and 17% respectively in the last quarter. This downturn is attributed to weakened demand in the PC market, leading to an anticipation of a continued low double-digit decline in these areas for Q3.
Trading Microsoft's shares
The prevailing risk-averse sentiment since the beginning of Q2 has effectively halted the ascending journey for Microsoft's stock prices, which surged by 38% from October 23 to March 2024. At the time of writing, the tech giant's share prices have declined more than 6% from its all-time high of $427.
Despite the recent pullback, TipRanks awards MSFT an 'outperform' smart score, with 32 out of 34 analysts recommending a buy in the past three months.
IG client sentiment consensus

Microsoft technical analysis
Looking at the daily chart, the price has experienced two significant breakouts recently, signalling that a further downtrend could be in the cards, including breaching the months-long ascending trendline and breaking below the 100-day moving average for the first time in 2024. Furthermore, the RSI has also fallen to its lowest level since November, underscoring the bearish momentum at the moment.
Technically, any further downtrend will find imminent support in the $379-$382 zone, where the 23.6% Fibonacci retracement and the previous high converge. A break below this support could open the door to challenge the crucial 200-day SMA, unbroken for over a year. On the other hand, the first upside target could be eyed at $415, where the 50-day SMA is situated.
Microsoft daily chart

- Risk warning: the figures stated are as of 23 April 2024. Past performance is not a reliable indicator of future performance. This report does not contain and is not to be taken as containing any financial product advice or financial product recommendation.
IGA, may distribute information/research produced by its respective foreign affiliates within the IG Group of companies pursuant to an arrangement under Regulation 32C of the Financial Advisers Regulations. Where the research is distributed in Singapore to a person who is not an Accredited Investor, Expert Investor or an Institutional Investor, IGA accepts legal responsibility for the contents of the report to such persons only to the extent required by law. Singapore recipients should contact IGA at 6390 5118 for matters arising from, or in connection with the information distributed.
The information/research herein is prepared by IG Asia Pte Ltd (IGA) and its foreign affiliated companies (collectively known as the IG Group) and is intended for general circulation only. It does not take into account the specific investment objectives, financial situation, or particular needs of any particular person. You should take into account your specific investment objectives, financial situation, and particular needs before making a commitment to trade, including seeking advice from an independent financial adviser regarding the suitability of the investment, under a separate engagement, as you deem fit.
No representation or warranty is given as to the accuracy or completeness of this information. Consequently, any person acting on it does so entirely at their own risk. Please see important Research Disclaimer.
Please also note that the information does not contain a record of our trading prices, or an offer of, or solicitation for, a transaction in any financial instrument. Any views and opinions expressed may be changed without an update.

Explore the markets with our free course
Discover and learn how the range of markets you can trade on with IG Academy's online course – ‘Introducing the financial markets’.
Put learning into action
Try out what you’ve learned in this shares strategy article risk-free in your demo account.
Ready to trade shares?
Put the lessons in this article to use in a live account – upgrading is quick and easy.
- Trade on over 10,000 popular global stocks
- Protect your capital with risk management tools
- React to breaking news with out-of-hours trading on 70 key US stocks
Inspired to trade?
Put your new knowledge into practice. Log in to your account now.
Live prices on most popular markets
- Forex
- Shares
- Indices
See more forex live prices
See more shares live prices
Prices above are subject to our website terms and agreements. Prices are indicative only. All shares prices are delayed by at least 15 mins.
See more indices live prices
Prices above are subject to our website terms and agreements. Prices are indicative only. All shares prices are delayed by at least 20 mins.
