Meta Platforms share price on watch for Q4 earnings
Meta Platforms’ share price has fallen close to 17% over the past six months. Can its upcoming Q4 earnings lift sentiments?


When does Meta Platforms report earnings?
Meta Platforms (formerly Facebook) is set to release its quarter four (Q4) 2021 financial results on 2 February 2022, after the market closes. At the time of writing, expectations for its Q4 earnings per share (EPS) is coming in at $3.84, down 1.0% year-on-year (YoY) and up 19.3% from the previous quarter.
Meta Platforms earnings – what to expect
Being a key leader in the social media space, Meta Platforms’ upcoming earnings may drive performance for Snap and Twitter, along with digital advertiser Alphabet. Expectations are for its revenue to come in at $33.4 billion, up 18.9% YoY and 15.1% from the previous quarter. Previously, Meta Platforms has missed market expectations for revenue in quarter three (Q3) 2021 and its forecast for Q4’s revenue at that time also came in below analysts’ estimates. With its share price on a downtrend ever since, the upcoming Q4 revenue will be on watch to validate if its sales growth can outperform.
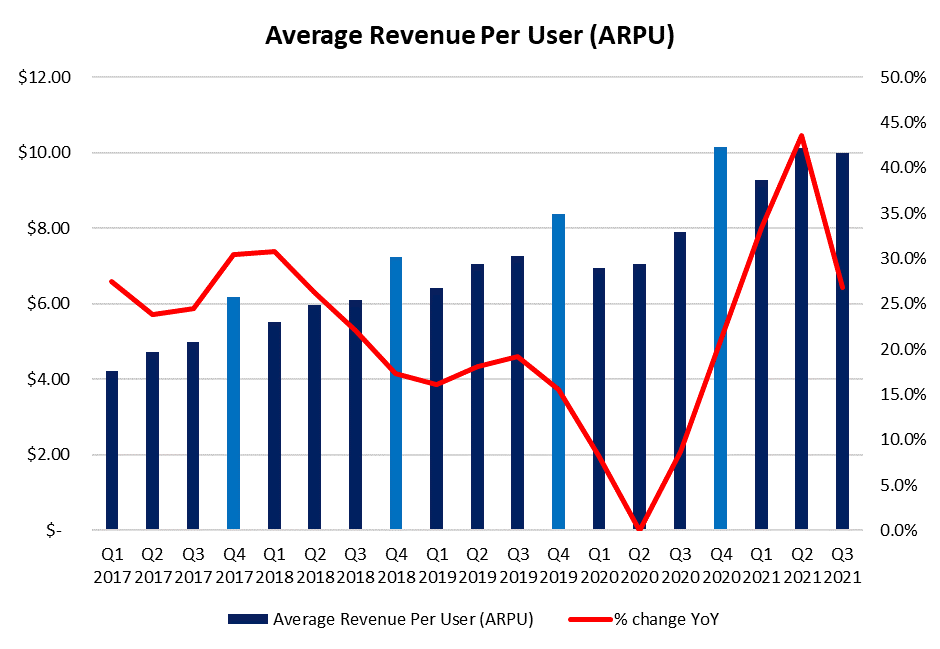
One of the key performance metric, the average revenue per user (ARPU), may also be in focus. Seasonally, Q4 tends to see the ARPU figure pull ahead from the other quarters, considering that the year-end holiday season may see greater ramp-up for business advertising. That said, Apple's iOS 14 changes which require apps to seek users’ permission for data collection and sharing remains a weighing factor. This comes in the form of potentially reducing Meta Platforms’ accuracy for ads targeting and limiting their ad pricing as a result. We have seen the impact surface in Q3, with its ARPU declining 1.2% quarter-on-quarter (QoQ), in what should traditionally be an increase. With that, any further impact on the holiday-driven Q4 will continue to be on watch in measuring Meta Platforms’ ability to mitigate these changes.
Metaverse?
With Facebook’s recent name change to Meta Platforms, the company has placed its focus in building the metaverse, where it may already seem to be better equipped than other companies in being the pioneer for the theme. For one, it has its Oculus division which provides virtual reality headsets as a portal to that realm and recently, the company has announced to be in the midst of creating an AI supercomputer – AI Research SuperCluster to power the metaverse.
While its investments in the metaverse may not contribute to its topline in the upcoming Q4 results, or even subsequent years to come, any vision from the management in earnings call will be closely watched. This may include projected costs for metaverse-related development, expected timeline for launch and further reaffirmation of monetisation plans.
Longer-term growth but near-term expenses
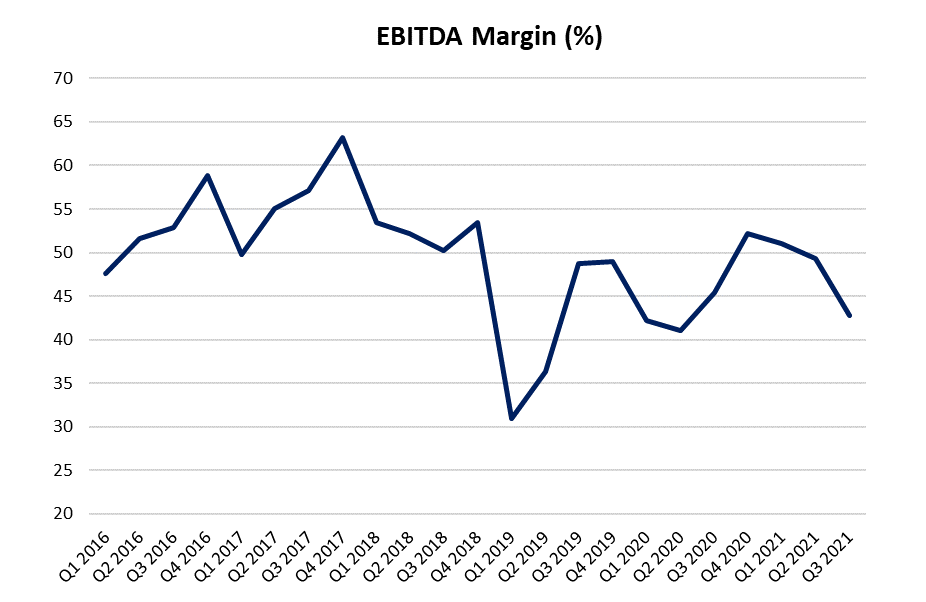
Investments for Metaverse, however, may lead to higher operating expenses and with the absence of any monetisation from that front in the near-term, its earnings before interest, taxes, depreciation, and amortization (EBITDA) margin may be expected to come under pressure. Meta Platforms has anticipated to spend at least $10 billion in 2021 and expect to increase its investments for the next several years. While its EBITDA margin remains at a promising level of 42.8% in Q3 2021, the management has guided for 2022 margins to be lower than 2021. With that, any impact on margins will continue to be monitored ahead.
Meta Platforms share price – technical analysis
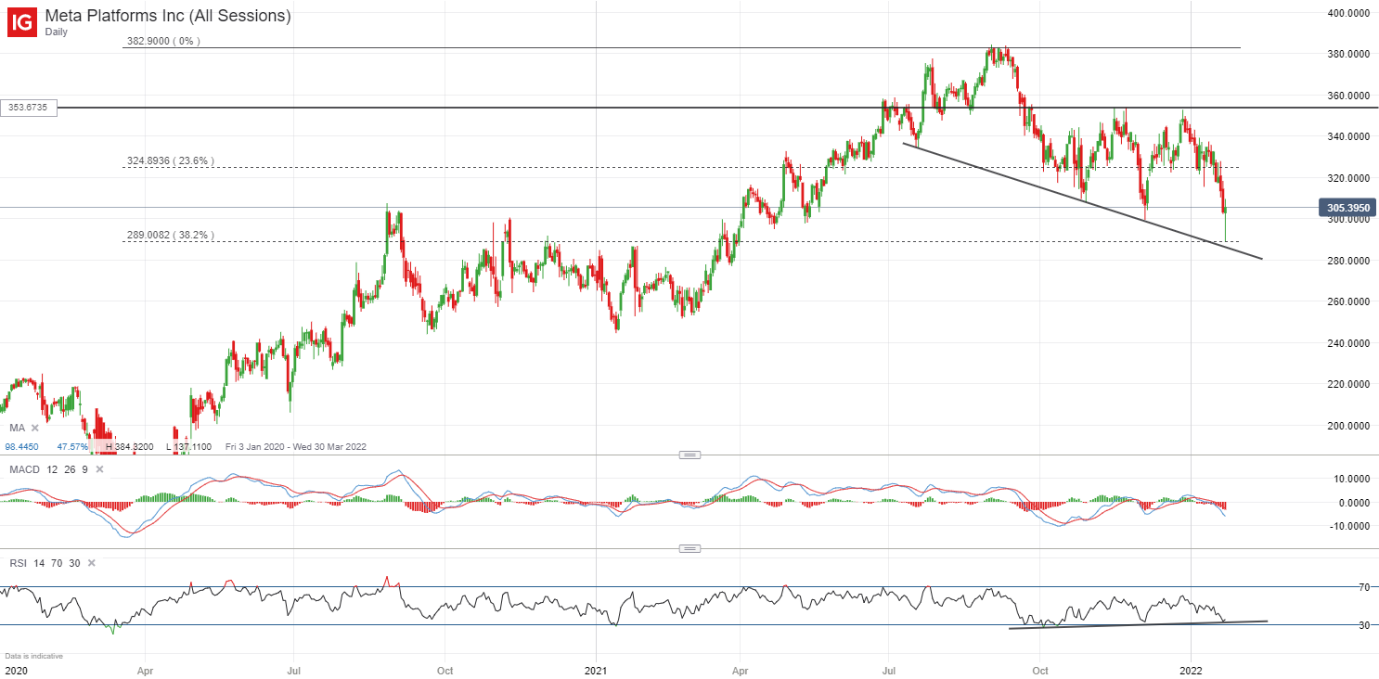
Meta Platforms’ share price has been trading within a near-term downtrend, as reflected by the series of lower highs and lower lows since its peak in August 2021. Recent attempt to break below the $300 psychological level was met with a bullish rejection off the 38.2% fibonacci retracement, displaying what seems to be a bullish pin bar. This may reflect an attempt by dip buyers to regain control.
While the higher lows on the relative strength index (RSI) may increase the chances of a near-term rebound, whether it marks a bottom for its share price still largely awaits to be seen. Resistance to overcome ahead may be at $325, where a 23.6% fibonacci retracement lies.
IGA, may distribute information/research produced by its respective foreign affiliates within the IG Group of companies pursuant to an arrangement under Regulation 32C of the Financial Advisers Regulations. Where the research is distributed in Singapore to a person who is not an Accredited Investor, Expert Investor or an Institutional Investor, IGA accepts legal responsibility for the contents of the report to such persons only to the extent required by law. Singapore recipients should contact IGA at 6390 5118 for matters arising from, or in connection with the information distributed.
The information/research herein is prepared by IG Asia Pte Ltd (IGA) and its foreign affiliated companies (collectively known as the IG Group) and is intended for general circulation only. It does not take into account the specific investment objectives, financial situation, or particular needs of any particular person. You should take into account your specific investment objectives, financial situation, and particular needs before making a commitment to trade, including seeking advice from an independent financial adviser regarding the suitability of the investment, under a separate engagement, as you deem fit.
No representation or warranty is given as to the accuracy or completeness of this information. Consequently, any person acting on it does so entirely at their own risk. Please see important Research Disclaimer.
Please also note that the information does not contain a record of our trading prices, or an offer of, or solicitation for, a transaction in any financial instrument. Any views and opinions expressed may be changed without an update.

Seize a share opportunity today
Go long or short on thousands of international stocks.
- Increase your market exposure with leverage
- Get spreads from just 0.1% on major global shares
- Trade CFDs straight into order books with direct market access
Live prices on most popular markets
- Forex
- Shares
- Indices
See more forex live prices
See more shares live prices
Prices above are subject to our website terms and agreements. Prices are indicative only. All shares prices are delayed by at least 15 mins.
See more indices live prices
Prices above are subject to our website terms and agreements. Prices are indicative only. All shares prices are delayed by at least 20 mins.
