JP Morgan Chase price breakout extends following Q2 results update
JP Morgan Chase (JPM) Q2 2023 results highlighted a strong financial performance, with net income and revenue boosted by the inclusion of First Republic Bank.


JP Morgan Q2 earnings
JP Morgan Chase (JPM) Q2 2023 results highlighted a strong financial performance with remarkable growth in net income, net revenue, and net interest income. Despite facing increased noninterest expenses and credit losses, the company's overall financial health remains robust.
Salient features of the results are as follows:
- Net income for the period was $14.5 billion, marking an increase of 67% compared to the prior year’s comparative period. Excluding First Republic, net income still rose by a substantial 40%.
- Net revenue also witnessed a notable growth of 34%, reaching $42.4 billion. Excluding First Republic, the growth was still considerable at 21%.
- Net interest income (NII) experienced an increase of 44% to reach $21.9 billion, driven primarily by higher rates. Excluding First Republic, NII still grew by an impressive 38%.
- Noninterest revenue grew by 25%, amounting to $20.5 billion. Excluding First Republic, the growth was 6%. This increase was mainly driven by higher noninterest revenue from CIB Markets and the absence of certain prior-year losses in Payments. However, it was partially offset by higher net investment securities losses in Corporate.
- Noninterest expenses rose by 11% to $20.8 billion. Excluding First Republic, the increase was 8%. This growth was primarily due to higher compensation expenses, including front office hiring and wage inflation, as well as investments in technology, marketing, and increased legal expenses.
JP Morgan Chase – technical view
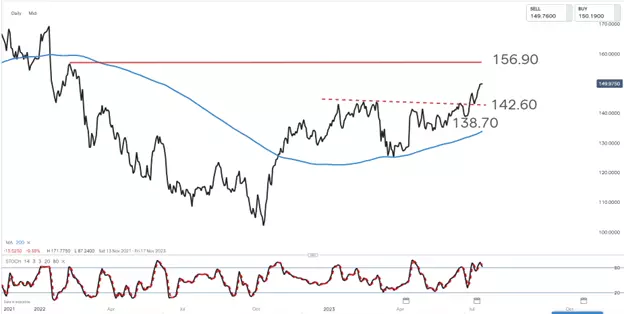
The share price of JP Morgan remains in a long-term uptrend, highlighted by the price trading firmly above the 200-day simple moving average (200MA) (blue line).
In the short term, a recent break above dotted trend line resistance level sees 156.90 as the initial upside resistance target from the move. The share price has however moved into overbought territory in the near term.
Traders looking for new long positions into the company might hope to find entry into a pullback from overbought territory towards the 142.60 level.
IGA, may distribute information/research produced by its respective foreign affiliates within the IG Group of companies pursuant to an arrangement under Regulation 32C of the Financial Advisers Regulations. Where the research is distributed in Singapore to a person who is not an Accredited Investor, Expert Investor or an Institutional Investor, IGA accepts legal responsibility for the contents of the report to such persons only to the extent required by law. Singapore recipients should contact IGA at 6390 5118 for matters arising from, or in connection with the information distributed.
The information/research herein is prepared by IG Asia Pte Ltd (IGA) and its foreign affiliated companies (collectively known as the IG Group) and is intended for general circulation only. It does not take into account the specific investment objectives, financial situation, or particular needs of any particular person. You should take into account your specific investment objectives, financial situation, and particular needs before making a commitment to trade, including seeking advice from an independent financial adviser regarding the suitability of the investment, under a separate engagement, as you deem fit.
No representation or warranty is given as to the accuracy or completeness of this information. Consequently, any person acting on it does so entirely at their own risk. Please see important Research Disclaimer.
Please also note that the information does not contain a record of our trading prices, or an offer of, or solicitation for, a transaction in any financial instrument. Any views and opinions expressed may be changed without an update.
Live prices on most popular markets
- Forex
- Shares
- Indices
See more forex live prices
See more shares live prices
Prices above are subject to our website terms and agreements. Prices are indicative only. All shares prices are delayed by at least 15 mins.
See more indices live prices
Prices above are subject to our website terms and agreements. Prices are indicative only. All shares prices are delayed by at least 20 mins.
