How will Alibaba shares fare for the rest of 2022?
The Chinese e-commerce giant’s shares soared on the back of a stronger fourth quarter.
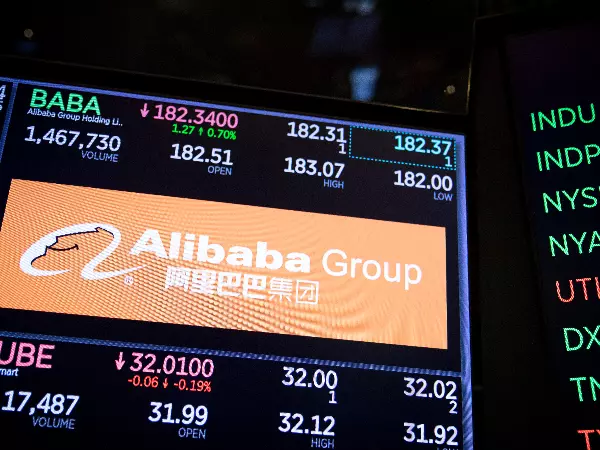

- Alibaba Group Holding (NYSE: BABA) share price closed 14.8% higher on Thursday (26 May 2022)
- The stock has rallied 12% in the last one month alone, on the back of positive regulatory news
- The e-commerce company saw revenue beat analyst estimates in its Q4 report
- Keen to trade Alibaba shares? Open an account with IG to long or short the stock now
BABA share price: what's the latest?
Alibaba’s US share price shot up as much as 15% on Thursday, following the release of its earnings for the March-ending quarter.
The e-commerce stock is up some 12% in the last one month alone, as the Chinese government states that it would ease up its regulatory probe on Chinese tech giants.
However, its share price is down by nearly 22% on a year-to-date basis, with China’s Covid Zero policy taking front and centre stage.
Despite the stock’s underperformance, it still has a consensus rating of ‘buy’ from 22 out of 26 analysts polled and an average price target of US$189.17 (equating to a 100% upside from its last traded price of US$94.50), based on the latest MarketBeat data.
The latest investment thesis came from brokerage firm Robert W. Baird, who reiterated an ‘outperform’ rating on the stock on 23 May 2022, while lowering price target to US$144 from US$160.
How did Alibaba fare in Q4?
On Thursday, the online shopping platform reported its fourth quarter financial results, where it saw revenue come in higher than analysts’ average estimates (based on Refinitiv data).
Alibaba’s revenue rose 9% year-on-year to 204.05 billion yuan (US$30.35 billion), against analyst estimates of 199.3 billion yuan (US$29.6 billion).
This was driven by the revenue growth of the China commerce segment by 8% year-over-year to 140.33 billion yuan (US$22.137 billion), local consumer services segment by 29% year-over-year to 10.45 billion yuan (US$1.647 billion) and cloud segment by 12% year-over-year to 18.97 billion yuan (US$3 billion).
Here are the other highlights:
- Income from operations was 16.7 billion yuan (US$2.637 billion), compared to a loss from operations of 7.66 billion yuan in the same quarter of 2021
- Adjusted EBITA, a non-GAAP measurement, decreased 30% year-over-year to 15.8 billion yuan (US$2.49 billion)
- Net loss attributable to ordinary shareholders was 16.24 billion yuan (US$2.56 billion) and net loss was 18.36 billion yuan (US$2.9 billion)
- Diluted loss per American Depository Share was 6.07 yuan (US$0.96) and diluted loss per share was 0.76 yuan (US$0.12 or HK$0.94)
- Net cash used in operating activities was 7.04 billion yuan (US$1.11 billion)
- Free cash flow, a non-GAAP measurement of liquidity, was an outflow of 15.07 billion yuan (US$2.4 billion), compared to an outflow of 658 million yuan in the same quarter of 2021, mainly due to the payment of the final instalment of 9.11 billion yuan (US$1.44 billion) of the 18.23 billion yuan fine levied by China’s State Administration for Market Regulation pursuant to China’s Anti-monopoly Law, and a decrease in profit.
IGA, may distribute information/research produced by its respective foreign affiliates within the IG Group of companies pursuant to an arrangement under Regulation 32C of the Financial Advisers Regulations. Where the research is distributed in Singapore to a person who is not an Accredited Investor, Expert Investor or an Institutional Investor, IGA accepts legal responsibility for the contents of the report to such persons only to the extent required by law. Singapore recipients should contact IGA at 6390 5118 for matters arising from, or in connection with the information distributed.
The information/research herein is prepared by IG Asia Pte Ltd (IGA) and its foreign affiliated companies (collectively known as the IG Group) and is intended for general circulation only. It does not take into account the specific investment objectives, financial situation, or particular needs of any particular person. You should take into account your specific investment objectives, financial situation, and particular needs before making a commitment to trade, including seeking advice from an independent financial adviser regarding the suitability of the investment, under a separate engagement, as you deem fit.
No representation or warranty is given as to the accuracy or completeness of this information. Consequently, any person acting on it does so entirely at their own risk. Please see important Research Disclaimer.
Please also note that the information does not contain a record of our trading prices, or an offer of, or solicitation for, a transaction in any financial instrument. Any views and opinions expressed may be changed without an update.

Seize a share opportunity today
Go long or short on thousands of international stocks.
- Increase your market exposure with leverage
- Get spreads from just 0.1% on major global shares
- Trade CFDs straight into order books with direct market access
Live prices on most popular markets
- Forex
- Shares
- Indices
See more forex live prices
See more shares live prices
Prices above are subject to our website terms and agreements. Prices are indicative only. All shares prices are delayed by at least 15 mins.
See more indices live prices
Prices above are subject to our website terms and agreements. Prices are indicative only. All shares prices are delayed by at least 20 mins.
