GlaxoSmithKline (GSK) Q1 2023 results preview, with broker ratings and price targets
The FTSE and NYSE listed GSK PLC is expected to report lower revenue and earnings for the first quarter, relative to the prior year's comparative period.

When is GlaxoSmithKline (GSK) earnings date?
The GlaxoSmithKline (GSK), the NYSE and FTSE listed global pharmaceutical company’s earnings release date is scheduled for the 26th of April 2023. The scheduled results will cover the groups first quarter of the 2023 fiscal year (Q1 2023).
GSK results preview: What does the street expect?
In terms of the upcoming results, a mean of analyst estimates compiled by Refinitiv data arrive at the following:
- Revenue GBP6.499bn (-33.59% year on year)
- Earnings per share (EPS) $0.34 (-17.07% year on year)
Q1 2023 results will find a strong base of comparison in Q1 2022 where COVID-19 solutions provided a meaningful contribution to both revenue and earnings. The group has stated that ‘based on known binding agreements with governments, GSK does not anticipate any significant COVID19 pandemic-related sales or operating profit in 2023’. Turnover and earnings are in turn expected to decline in both the first and second quarter of 2023.
How to trade the GlaxoSmithKline results
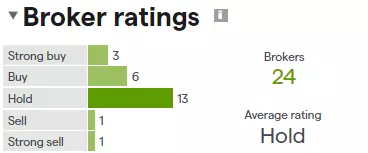
A Refinitiv poll of analyst ratings arrive have a long-term consensus rating of ‘hold’ for GlaxoSmithKline.
A consensus of analyst long-term price targets for GSK Plc (UK) arrives at a median price of GBP16.64.
A consensus of analyst long-term price targets for GSK Plc (US) arrives at a median price of $44.36.
GlaxoSmithKline (GSK) share price: technical analysis
GSK Plc (UK)
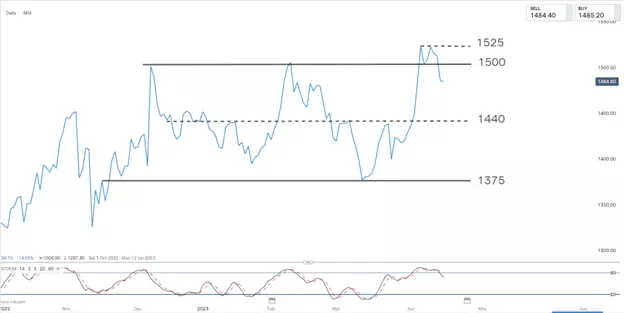
The share price of GSK continues to trade within a rangebound price environment between levels 1375 (support) and 1500 (resistance).
After a false break of range resistance, we see the price now retracing from overbought territory and towards the mid-point of the range at around 1440.
Traders who are short might consider using a close either above the 1500 or 1525 level as a stop loss indication for the trade (depending on threshold for risk).
Traders looking for long entry might instead wait for short term weakness to play out and end with a bullish price reversal around either the 1440 or 1375 support levels. Alternatively, a long breakout trade would be considered should wee see the price manage to close above resistance at 1525.
In summary
- GSK results are scheduled for the 26th of April 2023
- EPS and revenue are expected to decline against a a strong comparative quarter in the prior year’s comparative
- The broker consensus rating for GSK is a hold, although the share price continues to trade at a discount to the median of long-term price targets
IGA, may distribute information/research produced by its respective foreign affiliates within the IG Group of companies pursuant to an arrangement under Regulation 32C of the Financial Advisers Regulations. Where the research is distributed in Singapore to a person who is not an Accredited Investor, Expert Investor or an Institutional Investor, IGA accepts legal responsibility for the contents of the report to such persons only to the extent required by law. Singapore recipients should contact IGA at 6390 5118 for matters arising from, or in connection with the information distributed.
The information/research herein is prepared by IG Asia Pte Ltd (IGA) and its foreign affiliated companies (collectively known as the IG Group) and is intended for general circulation only. It does not take into account the specific investment objectives, financial situation, or particular needs of any particular person. You should take into account your specific investment objectives, financial situation, and particular needs before making a commitment to trade, including seeking advice from an independent financial adviser regarding the suitability of the investment, under a separate engagement, as you deem fit.
No representation or warranty is given as to the accuracy or completeness of this information. Consequently, any person acting on it does so entirely at their own risk. Please see important Research Disclaimer.
Please also note that the information does not contain a record of our trading prices, or an offer of, or solicitation for, a transaction in any financial instrument. Any views and opinions expressed may be changed without an update.
Live prices on most popular markets
- Forex
- Shares
- Indices
See more forex live prices
See more shares live prices
Prices above are subject to our website terms and agreements. Prices are indicative only. All shares prices are delayed by at least 15 mins.
See more indices live prices
Prices above are subject to our website terms and agreements. Prices are indicative only. All shares prices are delayed by at least 20 mins.
