EUR/USD slips, USD/JPY rises on appreciating US dollar but AUD/USD remains bid
Outlook on EUR/USD, USD/JPY and AUD/USD as a new year begins.

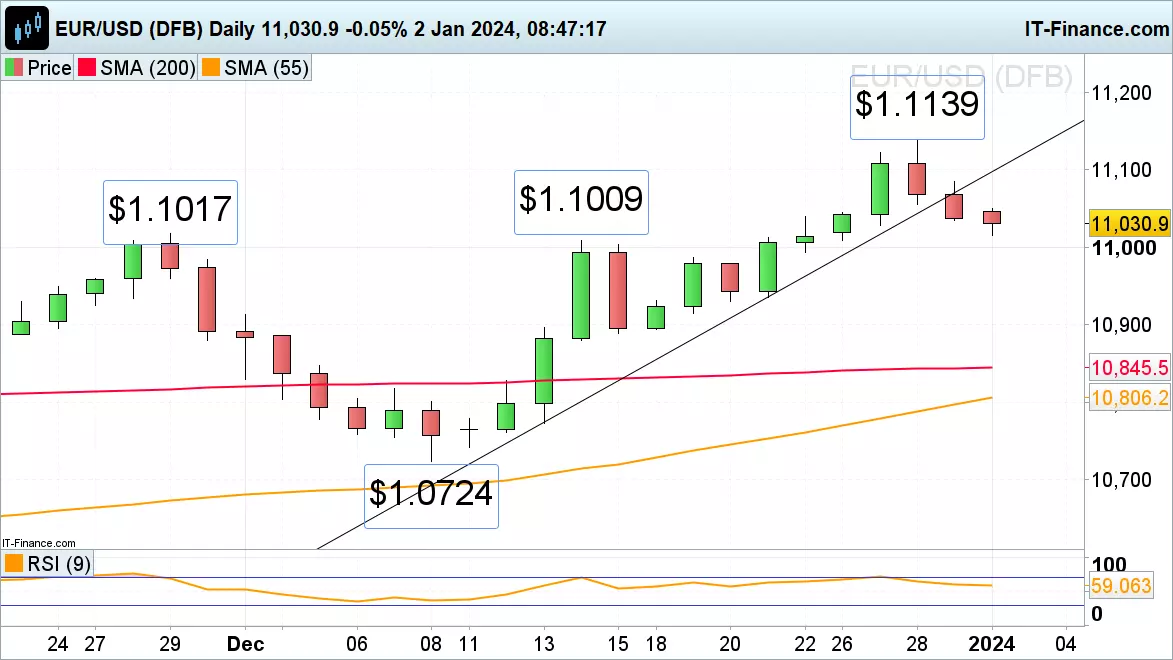
EUR/USD comes further off its five-month high
Last week EUR/USD managed to rise to $1.1139, close to its 27 July high at $1.1149, before correcting lower amid an appreciating US dollar for a third straight session.
The fall through the accelerated December uptrend line at $1.1096 led to the $1.1017 to $1.1009 November peak and mid-December high being revisited on Tuesday morning. Were this support zone to give way, the 19 December high at $1.0988 could be revisited. Above Tuesday’s intraday high at $1.1050 sits Friday’s $1.1084 high.
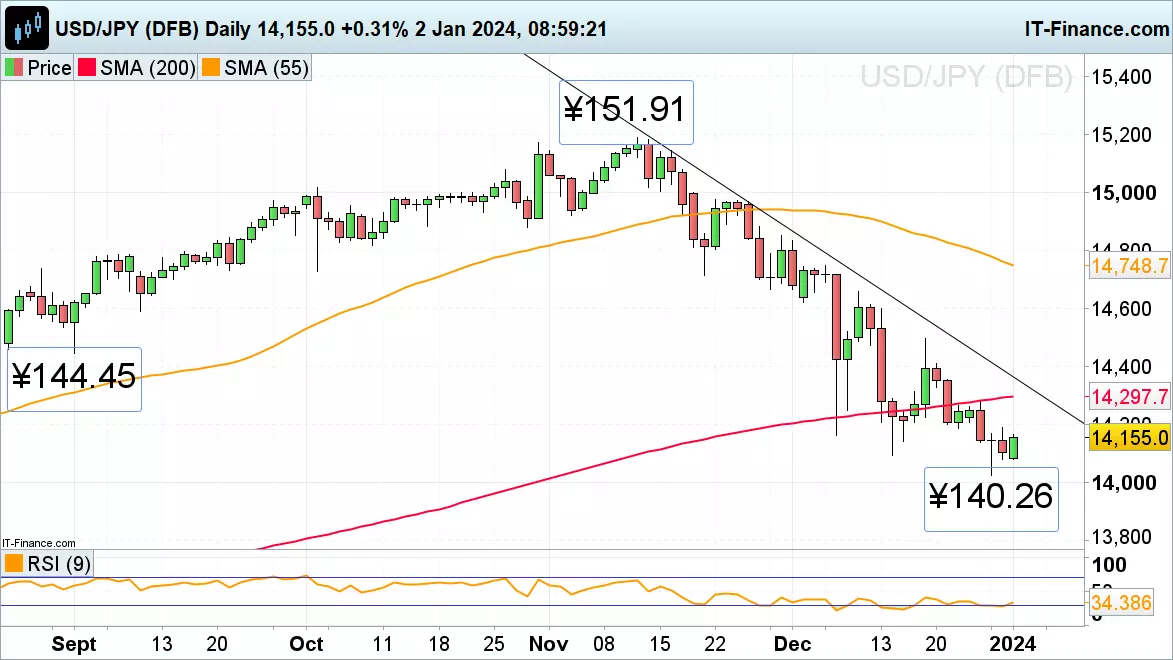
USD/JPY still hovers above five-month December low
USD/JPY is showing triple positive divergence on the daily Relative Strength Index (RSI) which accompanied last week’s low at ¥140.26 and points to a probable short-term bullish reversal in the currency pair.
A rise above Friday’s ¥141.91 high would put the 200-day simple moving average (SMA) and the November-to-January downtrend line at ¥142.97 to ¥143.64 on the cards. Minor support below Tuesday’s ¥140.81 intraday low sits at the ¥140.26 December trough.
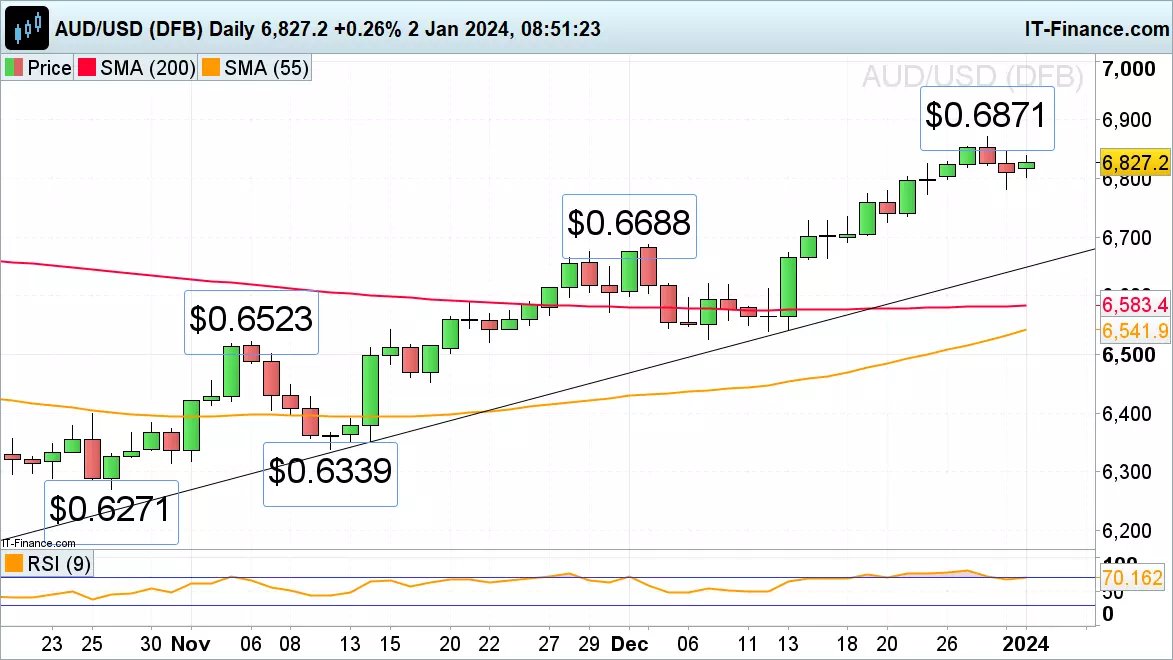
AUD/USD targets its five-month December high
AUD/USD’s minor correction from last week’s five-month December peak at $0.6871 to Friday’s $0.6782 low has been followed by an attempt to revisit last week’s peak. It remains in sight provided that Friday’s low at $0.6782 underpins with the June and July highs at $0.6894 to $0.6899 representing further possible upside targets.
Below support at $0.6782, the 19 December high can be spotted at $0.6774 and much further down the $0.6688 early December peak.
IGA, may distribute information/research produced by its respective foreign affiliates within the IG Group of companies pursuant to an arrangement under Regulation 32C of the Financial Advisers Regulations. Where the research is distributed in Singapore to a person who is not an Accredited Investor, Expert Investor or an Institutional Investor, IGA accepts legal responsibility for the contents of the report to such persons only to the extent required by law. Singapore recipients should contact IGA at 6390 5118 for matters arising from, or in connection with the information distributed.
The information/research herein is prepared by IG Asia Pte Ltd (IGA) and its foreign affiliated companies (collectively known as the IG Group) and is intended for general circulation only. It does not take into account the specific investment objectives, financial situation, or particular needs of any particular person. You should take into account your specific investment objectives, financial situation, and particular needs before making a commitment to trade, including seeking advice from an independent financial adviser regarding the suitability of the investment, under a separate engagement, as you deem fit.
No representation or warranty is given as to the accuracy or completeness of this information. Consequently, any person acting on it does so entirely at their own risk. Please see important Research Disclaimer.
Please also note that the information does not contain a record of our trading prices, or an offer of, or solicitation for, a transaction in any financial instrument. Any views and opinions expressed may be changed without an update.

Start trading forex today
Trade the largest and most volatile financial market in the world.
- Spreads start at just 0.6 points on EUR/USD
- Analyse market movements with our essential selection of charts
- Speculate from a range of platforms, including on mobile
Live prices on most popular markets
- Forex
- Shares
- Indices
See more forex live prices
See more shares live prices
Prices above are subject to our website terms and agreements. Prices are indicative only. All shares prices are delayed by at least 15 mins.
See more indices live prices
Prices above are subject to our website terms and agreements. Prices are indicative only. All shares prices are delayed by at least 20 mins.
