EUR/USD, GBP/USD and USD/JPY try to level out ahead of the weekend
Outlook on EUR/USD, GBP/USD and USD/JPY amid strong US growth and high US yields.


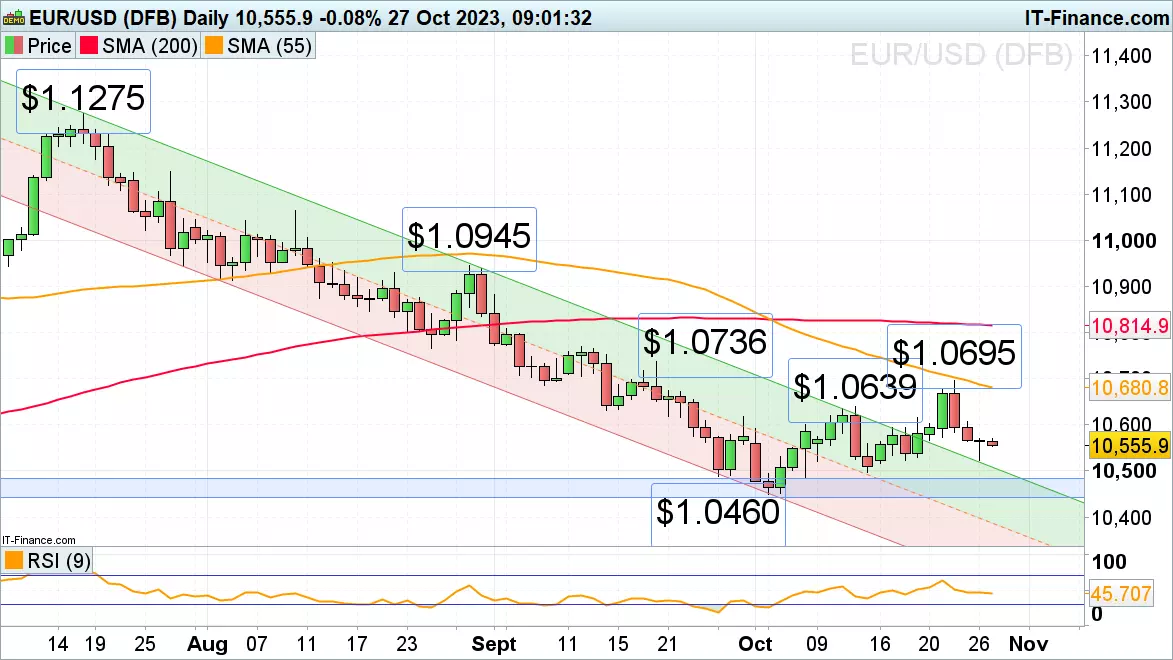
EUR/USD levels out despite heightened Middle East tensions
Despite heightened Middle East tensions and stronger-than-expected US growth, EUR/USD managed to bounce off its breached downtrend channel resistance line, now because of inverse polarity a support line, at $1.0522 on Thursday.
While this level holds, the mid-October high at $1.0639 may be revisited. For a medium-term bullish reversal to take shape, a rise and daily chart close above this week’s high at $1.0695 would need to be seen, though.
Below this week’s low at $1.0522 lies the mid-October low at $1.0496 and below it key support at $1.0484 to $1.0444, made up of the mid-November high, 7 December and 6 January lows. It needs to hold for EUR/USD to be able to bottom out.
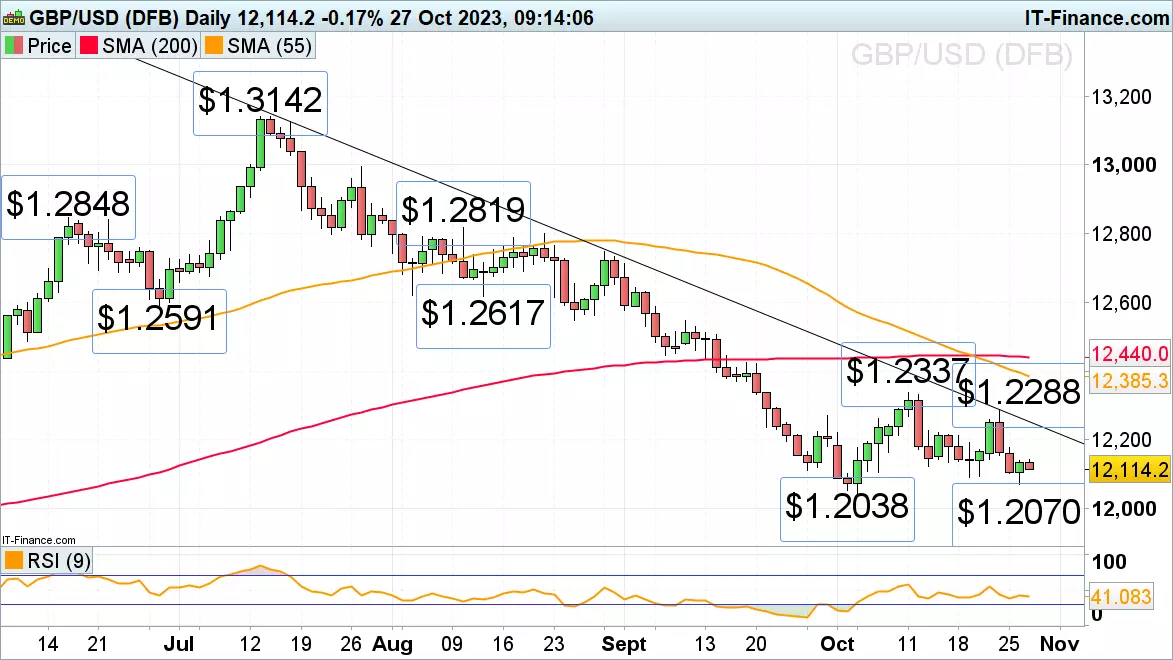
GBP/USD hovers above its $1.2038 early October low
GBP/USD's slide towards its early-October seven-month low at $1.2038 is showing minor signs of slowing down while Thursday’s low at $1.207 underpins and as profit taking in US dollar longs ahead of the weekend gains traction.
A fall through $1.2038 would put the psychological $1.20 mark on the map, however.
Minor resistance above the mid-October $1.2123 low comes in around the $1.2216 to $1.2225 region which capped the cross a couple of weeks ago. While trading below this resistance area, downside pressure should remain dominant.
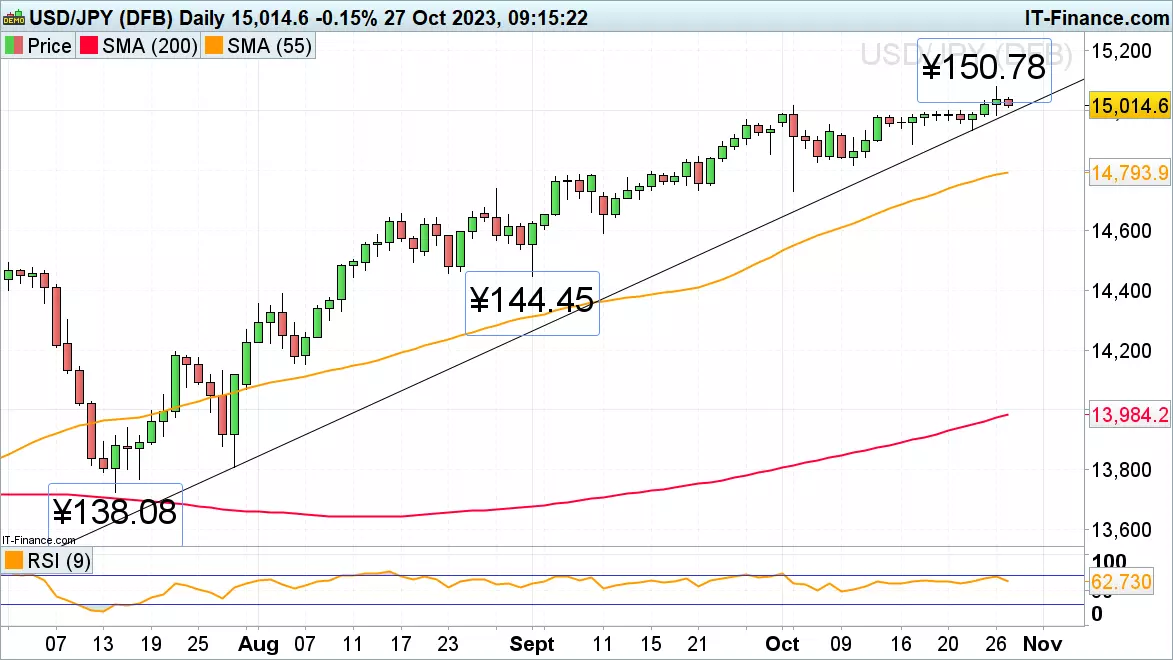
USD/JPY cautiously trades above the psychological ¥150.00 mark
Over the past couple of days USD/JPY has been cautiously trading above the psychological ¥150.00 mark, so far without the Bank of Japan (BoJ) intervening despite the early-October high at ¥150.16 having been overcome and a new one-year high being made at ¥150.78.
It lies close to the October 2022 peak at ¥150.94 around which the central bank might well intervene, though.
If so, the July-to-October tentative uptrend line at ¥149.86 would likely give way with this week’s low at ¥149.33 and the next lower 17 October low at ¥148.85 being expected to then be hit.
IGA, may distribute information/research produced by its respective foreign affiliates within the IG Group of companies pursuant to an arrangement under Regulation 32C of the Financial Advisers Regulations. Where the research is distributed in Singapore to a person who is not an Accredited Investor, Expert Investor or an Institutional Investor, IGA accepts legal responsibility for the contents of the report to such persons only to the extent required by law. Singapore recipients should contact IGA at 6390 5118 for matters arising from, or in connection with the information distributed.
The information/research herein is prepared by IG Asia Pte Ltd (IGA) and its foreign affiliated companies (collectively known as the IG Group) and is intended for general circulation only. It does not take into account the specific investment objectives, financial situation, or particular needs of any particular person. You should take into account your specific investment objectives, financial situation, and particular needs before making a commitment to trade, including seeking advice from an independent financial adviser regarding the suitability of the investment, under a separate engagement, as you deem fit.
No representation or warranty is given as to the accuracy or completeness of this information. Consequently, any person acting on it does so entirely at their own risk. Please see important Research Disclaimer.
Please also note that the information does not contain a record of our trading prices, or an offer of, or solicitation for, a transaction in any financial instrument. Any views and opinions expressed may be changed without an update.

Start trading forex today
Trade the largest and most volatile financial market in the world.
- Spreads start at just 0.6 points on EUR/USD
- Analyse market movements with our essential selection of charts
- Speculate from a range of platforms, including on mobile
Live prices on most popular markets
- Forex
- Shares
- Indices
See more forex live prices
See more shares live prices
Prices above are subject to our website terms and agreements. Prices are indicative only. All shares prices are delayed by at least 15 mins.
See more indices live prices
Prices above are subject to our website terms and agreements. Prices are indicative only. All shares prices are delayed by at least 20 mins.
