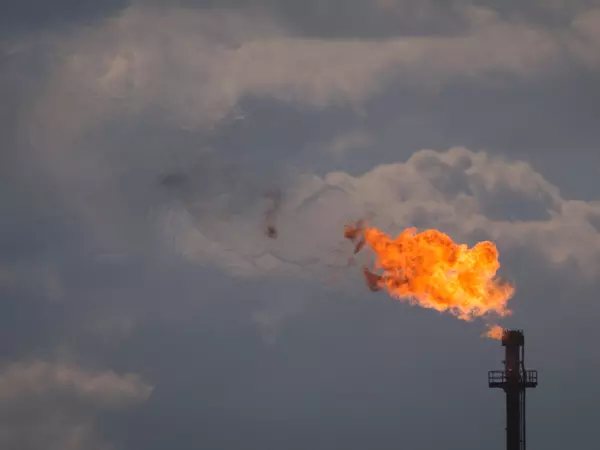
Crude oil faces perfect storm if US inflation pours gasoline on uncertainty flame
Crude oil extends losses during Tuesday Asia-Pacific trading session; market uncertainty may be pushed further with traders eyeing US CPI and another sticker print could reinvigorate hawkish Fed policy estimates.

WTI crude oil prices fell 2.55% on Monday as market volatility remained elevated in the fallout of last week’s collapse of Silicon Valley Bank. Since last Wednesday, the commodity is down about 3.3%.
Sentiment-linked crude oil was and may continue to remain vulnerable in the coming days/weeks/months as traders assess the likelihood of the United States economy entering a recession. Despite steps taken by the government to shore up confidence in the banking system, investors punished regional bank stocks on Monday.
However, a closer glance reveals that the market reaction on Monday seems to place much more emphasis on expectations of a Federal Reserve pivot than worries about a recession (for now). In fact, traders have priced in about 150 basis points in rate cuts by the Fall of this year. In response, the haven-linked US dollar sank, and traders piled into tech stocks. The Nasdaq 100 outperformed the Dow Jones.
During Tuesday’s Asia-Pacific trading session, sentiment woes continued deteriorating crude oil prices, with WTI falling almost 1.25% by 3 GMT.
Over the remaining 24 hours, market uncertainty could be pushed further. All eyes are on the 12:30 GMT US CPI report. In February, inflation is seen slowing further to 6.0% y/y from 6.4%. As a reminder, January’s print was stickier than anticipated. Another surprisingly strong print could bring back Fed rate hike expectations, placing crude oil at risk.
Crude oil technical analysis
On the daily chart, crude oil is fast approaching the floor of a Bearish Rectangle chart formation. The price seems to be around 72.27. However, immediately below is the December low at 70.10 – 71.13. Confirming a breakout under the latter exposes lows from May 2021.
Crude oil daily chart

Crude oil sentiment analysis - bearish
Looking at IG Client Sentiment (IGCS), which tends to be a contrarian indicator, about 82.78% of retail traders are net-long crude oil. Since most of them are biased to the upside, this hints that prices may continue falling. Meanwhile, upside exposure increased by 9.56% and 30.63%, respectively.
With that in mind, the combination of overall positioning and recent changes in exposure offers a stronger bearish bias.

This information has been prepared by DailyFX, the partner site of IG offering leading forex news and analysis. In addition to the disclaimer below, the material on this page does not contain a record of our trading prices, or an offer of, or solicitation for, a transaction in any financial instrument. IG accepts no responsibility for any use that may be made of these comments and for any consequences that result. No representation or warranty is given as to the accuracy or completeness of this information. Consequently any person acting on it does so entirely at their own risk. Any research provided does not have regard to the specific investment objectives, financial situation and needs of any specific person who may receive it. It has not been prepared in accordance with legal requirements designed to promote the independence of investment research and as such is considered to be a marketing communication. Although we are not specifically constrained from dealing ahead of our recommendations we do not seek to take advantage of them before they are provided to our clients.
IGA, may distribute information/research produced by its respective foreign affiliates within the IG Group of companies pursuant to an arrangement under Regulation 32C of the Financial Advisers Regulations. Where the research is distributed in Singapore to a person who is not an Accredited Investor, Expert Investor or an Institutional Investor, IGA accepts legal responsibility for the contents of the report to such persons only to the extent required by law. Singapore recipients should contact IGA at 6390 5118 for matters arising from, or in connection with the information distributed.
The information/research herein is prepared by IG Asia Pte Ltd (IGA) and its foreign affiliated companies (collectively known as the IG Group) and is intended for general circulation only. It does not take into account the specific investment objectives, financial situation, or particular needs of any particular person. You should take into account your specific investment objectives, financial situation, and particular needs before making a commitment to trade, including seeking advice from an independent financial adviser regarding the suitability of the investment, under a separate engagement, as you deem fit.
No representation or warranty is given as to the accuracy or completeness of this information. Consequently, any person acting on it does so entirely at their own risk. Please see important Research Disclaimer.
Please also note that the information does not contain a record of our trading prices, or an offer of, or solicitation for, a transaction in any financial instrument. Any views and opinions expressed may be changed without an update.

Explore the markets with our free course
Discover the range of markets you can spread bet on - and learn how they work - with IG Academy's online course.
Turn knowledge into success
Practice makes perfect. Take what you’ve learned in this index strategy article, and try it out risk-free in your demo account.
Ready to trade indices?
Put the lessons in this article to use in a live account. Upgrading is quick and simple.
- Get fixed spreads from 1 point on FTSE 100 and Germany 40
- Protect your capital with risk management tools
- Trade more 24-hour markets than any other provider – 26 in total
Inspired to trade?
Put the knowledge you’ve gained from this article into practice. Log in to your account now.
Live prices on most popular markets
- Forex
- Shares
- Indices
See more forex live prices
See more shares live prices
Prices above are subject to our website terms and agreements. Prices are indicative only. All shares prices are delayed by at least 15 mins.
See more indices live prices
Prices above are subject to our website terms and agreements. Prices are indicative only. All shares prices are delayed by at least 20 mins.
