Asia Day Ahead: Calm before the storm with key economic releases ahead this week
Wall Street has a stellar end to 2023, with the S&P 500 up close to 25% for the year while delivering a nine-week winning streak as a year-end finale – its best streak since 2004.


Market Recap
Wall Street has a stellar end to 2023, with the S&P 500 up close to 25% for the year while delivering a nine-week winning streak as a year-end finale – its best streak since 2004. Overbought technical conditions remain an argument for some near-term cooling in the rally, but on the broader perspective, there seems to be little standing in the way of the prevailing upward trend for now, as easing US inflation and resilient economic conditions continue to feed into dovish Federal Reserve (Fed) expectations and soft landing hopes.
At the time of writing, US equity futures point to a positive start to the new year, as the Santa Claus rally rocks on (rally phenomenon inclusive of first two trading days of January). But as trading volume returns from the holiday break, it may be the calm before the storm as we look towards a series of key economic releases over the coming days. Notably, eyes will be on the Fed minutes this week to clarify if markets have gotten ahead of themselves in terms of dovish expectations. The week will also round up with the US December job report, where further softening in US labour conditions are preferred but still displaying some distance away from recessionary levels.
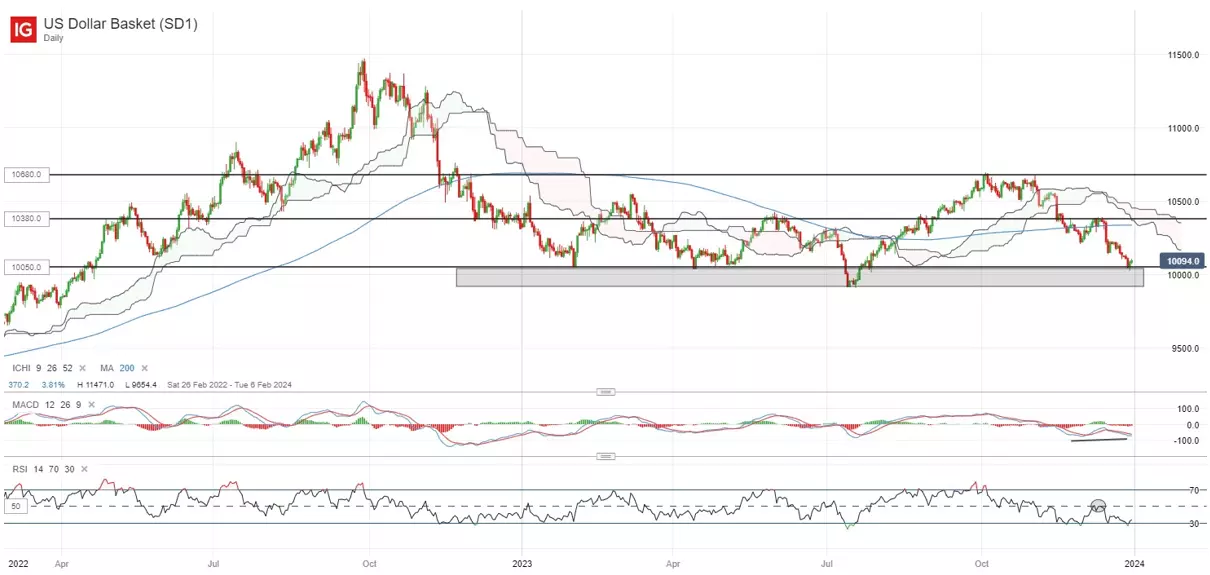
The US dollar index has traded in tandem with lower Treasury yields to touch its five-month low lately but as it edges towards a crucial support zone, there may be some attempt to stabilise around the 100.50 level of support. Any near-term bounce from current level may also support a bullish divergence on its daily moving average convergence/divergence (MACD), although it may still have to take much more for the downward trend to reverse. Failure for the 100.50 level to hold could leave the 99.20 level in sight, while on the upside, any near-term bounce may leave the 101.80 level on watch.
Asia Open
Asian stocks look set for a mixed open, with ASX +0.43% and KOSPI -0.24% at the time of writing. Japan and New Zealand markets remain off for holiday, which may set the stage for a quieter start to the new week. Nevertheless, economic releases over the holiday weekend offer some data for market sentiments to digest, with China’s official purchasing managers' index (PMI) reinforcing the tough growth conditions in the world’s second-largest economy.
In December, China’s manufacturing activities continue to contract for the third straight month (49.0 versus 49.5 consensus), while non-manufacturing PMI also came in slightly below expectations (50.4 versus 50.5 consensus). Until economic conditions offer a sustained trend of recovery to provide conviction for markets that the worst is over, the divergence with global equities may be set to continue. Ahead, China’s Caixin manufacturing PMI data will be on watch, which is expected to ease to 50.4 from previous 50.7, with any weak reading likely to amplify calls for more policy stimulus into 2024.
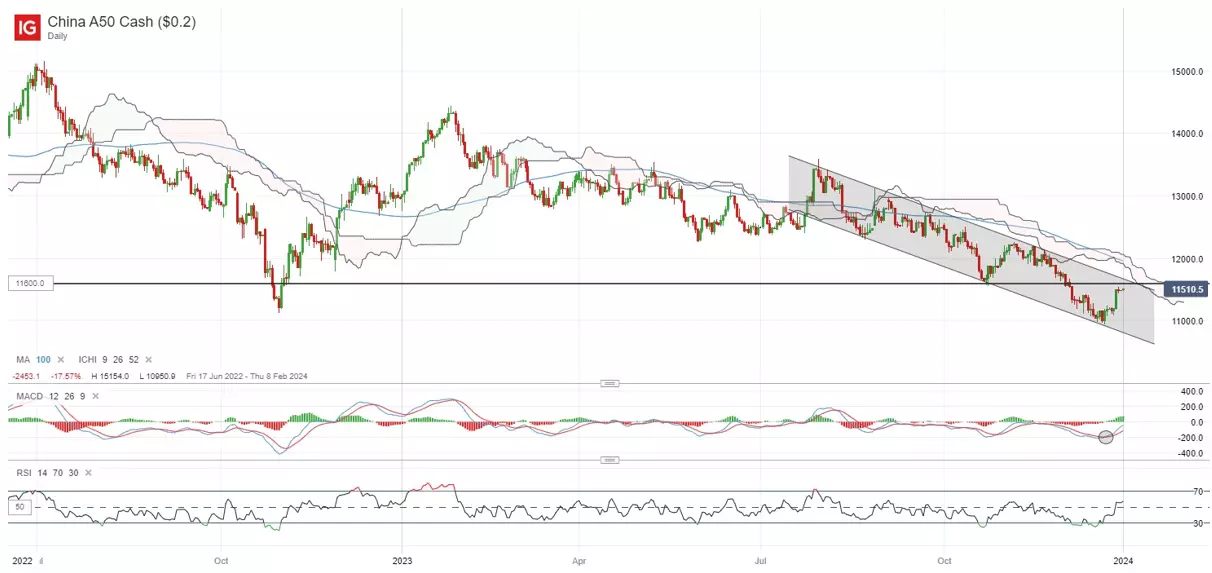
The China A50 has managed to recover lately after a retest of its October 2022 low, but a series of resistance remain key to overcome to signal for a trend reversal to the upside. This includes the upper trendline resistance of a descending channel in place since August last year, alongside its Ichimoku cloud resistance on the daily chart and various moving averages (MA). Until then, the broader downward bias may remain, with the formation of lower highs and lower lows still in place since February 2021.
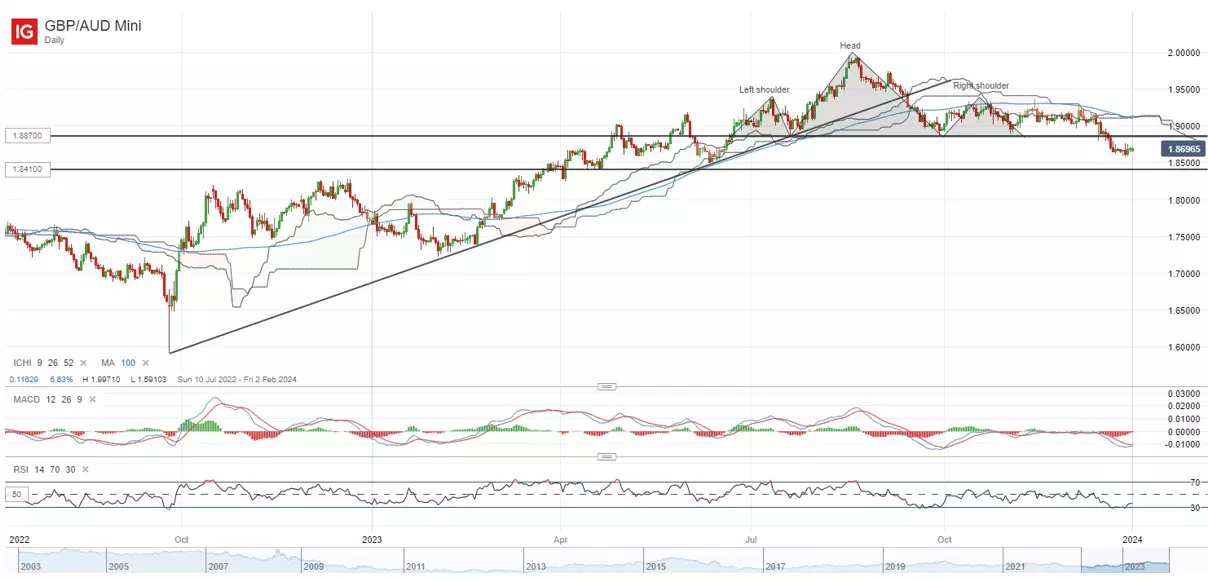
On the watchlist: GBP/AUD in near-term consolidation but remains below head-and-shoulder neckline
The upward trend in the GBP/AUD has seen some loss in momentum over the past months, with the pair edging to its six-month low last month after a period of consolidation. Having seemingly formed a head-and-shoulder formation since June 2023, recent downside marks a breakdown of the formation neckline at the 1.887 level, as the pair struggled to cross back above its Ichimoku cloud resistance on the daily chart on multiple occasions.
Any attempt to bounce on near-term oversold technical conditions may face a crucial test of resistance at the 1.887 level. For now, the broader downward bias may remain as the daily relative strength index (RSI) continues to trade below the key 50 level, which may leave eyes on the 1.841 level for a retest ahead.
Friday: DJIA -0.05%; S&P 500 -0.28%; Nasdaq -0.56%, DAX +0.30%, FTSE +0.14%
IGA, may distribute information/research produced by its respective foreign affiliates within the IG Group of companies pursuant to an arrangement under Regulation 32C of the Financial Advisers Regulations. Where the research is distributed in Singapore to a person who is not an Accredited Investor, Expert Investor or an Institutional Investor, IGA accepts legal responsibility for the contents of the report to such persons only to the extent required by law. Singapore recipients should contact IGA at 6390 5118 for matters arising from, or in connection with the information distributed.
The information/research herein is prepared by IG Asia Pte Ltd (IGA) and its foreign affiliated companies (collectively known as the IG Group) and is intended for general circulation only. It does not take into account the specific investment objectives, financial situation, or particular needs of any particular person. You should take into account your specific investment objectives, financial situation, and particular needs before making a commitment to trade, including seeking advice from an independent financial adviser regarding the suitability of the investment, under a separate engagement, as you deem fit.
No representation or warranty is given as to the accuracy or completeness of this information. Consequently, any person acting on it does so entirely at their own risk. Please see important Research Disclaimer.
Please also note that the information does not contain a record of our trading prices, or an offer of, or solicitation for, a transaction in any financial instrument. Any views and opinions expressed may be changed without an update.

Seize a share opportunity today
Go long or short on thousands of international stocks.
- Increase your market exposure with leverage
- Get spreads from just 0.1% on major global shares
- Trade CFDs straight into order books with direct market access
Live prices on most popular markets
- Forex
- Shares
- Indices
See more forex live prices
See more shares live prices
Prices above are subject to our website terms and agreements. Prices are indicative only. All shares prices are delayed by at least 15 mins.
See more indices live prices
Prices above are subject to our website terms and agreements. Prices are indicative only. All shares prices are delayed by at least 20 mins.
