Asia Day Ahead: Brent crude back to retest 200-day MA, AUD/USD sustained breakout
Wall Street continued to take comfort from falling US yields overnight, which paved the way for rate-sensitive tech to lift the Nasdaq to a fresh year-to-date high.


Market Recap
Wall Street continued to take comfort from falling US yields overnight, which paved the way for rate-sensitive tech to lift the Nasdaq to a fresh year-to-date high. The US 10-year yields now stand at 4.42%, a near two-month low, although US two-year yields firmed slightly overnight. There has not been much on the economic calendar to start the week, except for a further decline in the US Conference Board Leading Index. But with the index sending a recession signal since 2022, which clearly has not played out yet, negative reaction to the data has been short-lived as markets continue to bask in soft landing hopes.
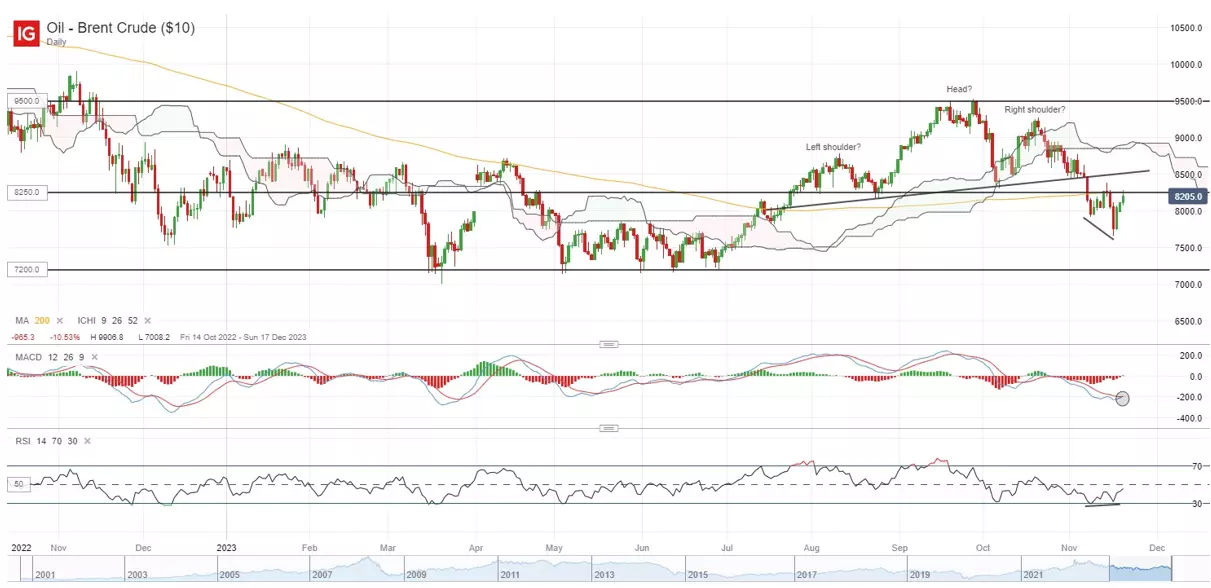
Oil prices have been getting much hype, having dipped into the red for four straight weeks but are attempting to pare some losses lately on expectations of further supply cuts from Organization of the Petroleum Exporting Countries (OPEC) this week. That said, previous rounds of supply cuts did not seem to have much lasting boost on oil prices, as its outlook is weighed with demand conditions.
Brent crude prices are back to retest its 200-day moving average (MA) currently, but a head-and-shoulder breakdown at the start of the month and a move below its daily Ichimoku cloud support suggest that much may still await. Near-term, the US$82.50 level at its 200-day MA will serve as immediate resistance to overcome, failing which may drive a retest of its November low at the US$77.40 level.
Asia Open
Asian stocks look set for a mixed open, with Nikkei -0.33%, ASX +0.15% and KOSPI +0.87% at the time of writing. The headline yesterday was on the Nikkei index touching a fresh 33-year high, only for it to reverse course and end the day lower. Nevertheless, it could be due to some near-term reservations from the shortened trading week in US and Japan, with technicals still suggesting an upward trend in place.
Chinese stocks received a boost as well, with the Hang Seng Index up close to 300 points in yesterday’s session while the Nasdaq Golden Dragon China Index was up 3.6% overnight. While the People's Bank of China (PBoC) has left its one-year and five-year Loan Prime Rates unchanged, investors are taking the cue from authorities’ pledges to support the property sector that more supportive policy measures will eventually follow.
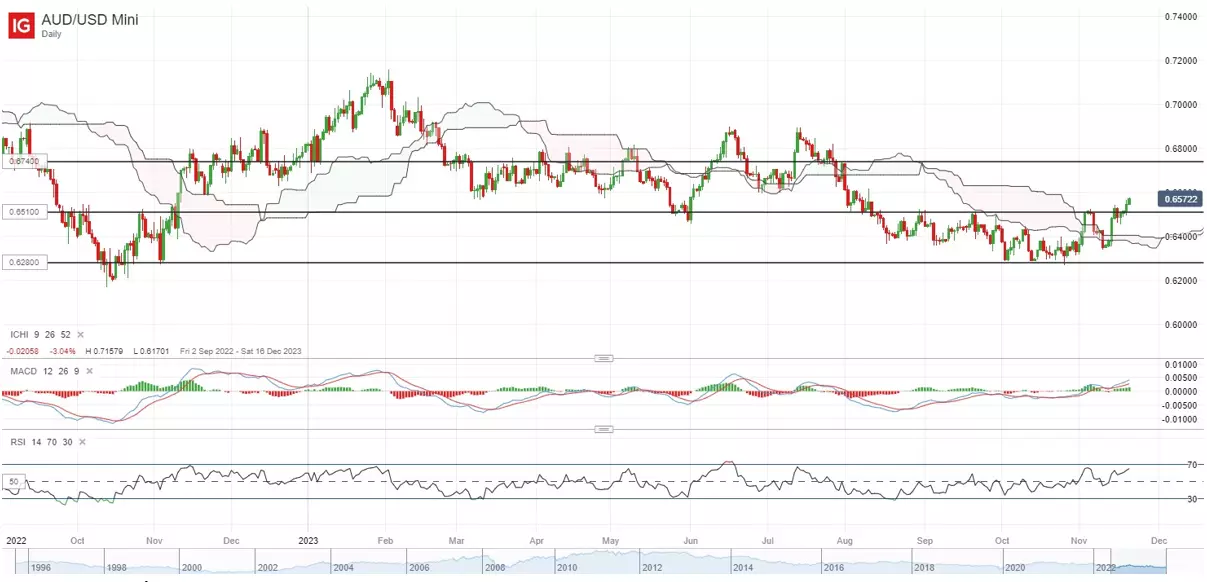
On the other hand, the Reserve Bank of Australia (RBA) minutes this morning highlighted increased inflation risks as the basis for the November rate hike, with statements quoting rising house prices and staff forecasts suggesting room for additional hike. Much could hinge on Australia’s inflation data to dictate the central bank’s next move, given the RBA’s assertive stance that it is ‘important to prevent even a modest further increase in inflation expectations’.
The AUD/USD reacted with a push higher this morning, sustaining its upward breakout of a consolidation pattern in place since August this year. A weekly bullish crossover was formed on moving average convergence/divergence (MACD), with the pair potentially setting its sight on the 0.674 level next. The level will be a crucial resistance to overcome, having been marked by its weekly Ichimoku cloud resistance which the pair has failed to overcome on at least three occasions since February 2022.
On the watchlist: Double-top formation breakdown for USD/JPY
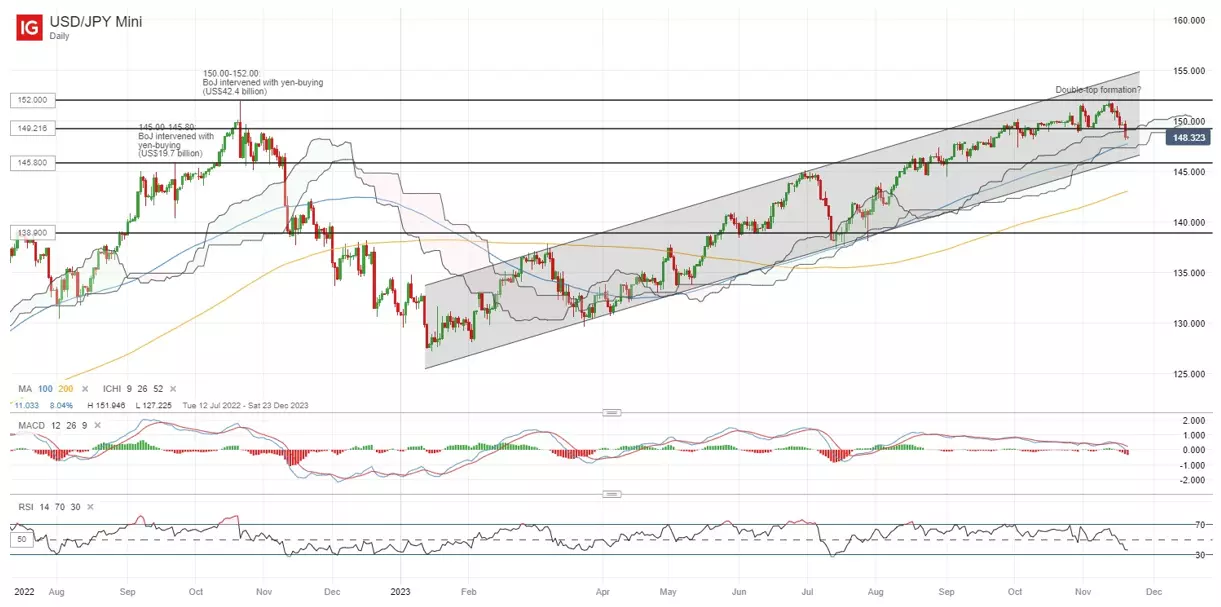
The USD/JPY continues to take its cue from the weaker US dollar, pushing to a new six-week low as US-Japan 10-year bond yield differentials narrow. Recent sell-off seems to mark a breakdown of a near-term double-top formation, as the neckline at the 149.20 level gave way to start the new week. As a reflection of bearish momentum in place, its relative strength index (RSI) on the daily chart has dipped below the key 50 level for the first time since July 2023.
A crucial support to watch ahead may be at the 145.80 level, where a lower channel trendline support stands alongside its daily Ichimoku cloud. Failure for the level to hold may risk a wider trend reversal to the downside, which may place the 142.00 level on watch next.
Monday: DJIA +0.58%; S&P 500 +0.74%; Nasdaq +1.13%, DAX -0.11%, FTSE -0.11%
IGA, may distribute information/research produced by its respective foreign affiliates within the IG Group of companies pursuant to an arrangement under Regulation 32C of the Financial Advisers Regulations. Where the research is distributed in Singapore to a person who is not an Accredited Investor, Expert Investor or an Institutional Investor, IGA accepts legal responsibility for the contents of the report to such persons only to the extent required by law. Singapore recipients should contact IGA at 6390 5118 for matters arising from, or in connection with the information distributed.
The information/research herein is prepared by IG Asia Pte Ltd (IGA) and its foreign affiliated companies (collectively known as the IG Group) and is intended for general circulation only. It does not take into account the specific investment objectives, financial situation, or particular needs of any particular person. You should take into account your specific investment objectives, financial situation, and particular needs before making a commitment to trade, including seeking advice from an independent financial adviser regarding the suitability of the investment, under a separate engagement, as you deem fit.
No representation or warranty is given as to the accuracy or completeness of this information. Consequently, any person acting on it does so entirely at their own risk. Please see important Research Disclaimer.
Please also note that the information does not contain a record of our trading prices, or an offer of, or solicitation for, a transaction in any financial instrument. Any views and opinions expressed may be changed without an update.

Seize a share opportunity today
Go long or short on thousands of international stocks.
- Increase your market exposure with leverage
- Get spreads from just 0.1% on major global shares
- Trade CFDs straight into order books with direct market access
Live prices on most popular markets
- Forex
- Shares
- Indices
See more forex live prices
See more shares live prices
Prices above are subject to our website terms and agreements. Prices are indicative only. All shares prices are delayed by at least 15 mins.
See more indices live prices
Prices above are subject to our website terms and agreements. Prices are indicative only. All shares prices are delayed by at least 20 mins.
