American Airlines share price: what can we expect from the Q4 results?
The Nasdaq listed air carrier operator for passengers and cargo, is set to report fourth quarter earnings for 2023 (Q4 2023) on the 25th of January 2024.


Key takeaways
- American Airlines will release Q4 results on the 25th of January 2024
- Q4 2023 earnings per share of $0.10 expected
- A mean of analyst forecasts suggests a long-term price target of $15.36
- A consensus of analyst ratings have a ‘hold’ rating on the stock
When are the American Airline results?
American Airlines Group Inc. the Nasdaq listed air carrier operator for passengers and cargo, is set to report fourth quarter earnings for 2023 (Q4 2023) on the 25th of January 2024.
What to expect from American Airlines Q4 2023 results?
In the groups previous fiscal quarter results (Q3 2023), the following was guided for the upcoming results:
‘Based on demand trends and the current fuel price forecast and excluding the impact of special items3, the company expects its fourth-quarter 2023 adjusted operating margin to be 2% to 4%. American now expects its full-year 2023 adjusted operating margin to be approximately 7%’.
A consensus of analyst estimates from Refinitiv data suggests the following in terms of the upcoming results:
- Q4 2023 revenue to have decreased by 1.3% year on year (y/y)
- Full Year 2023 (FY 2023) revenue to have increased by 7.7% from the previous year to $52.754bn
- Q4 2023 earnings per share of $0.10
- FY 2023 earnings per share of $2.46
How to trade the American Airline results
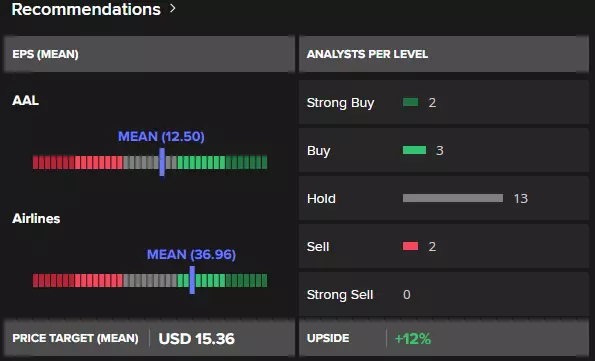
As of the 22nd of January 2024, a Refinitiv poll of analyst / broker ratings on American Airlines suggests the share to be a hold at current levels. However, a mean of these analyst price targets suggests the stock price to currently be trading at a 12% to what is deemed a longer-term fair value for the counter.
American Airlines share price: technical view
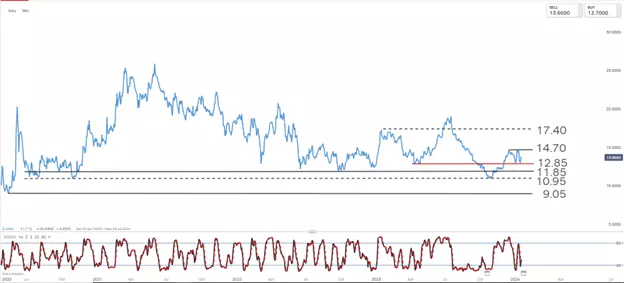
The share price of American Airlines currently trades in a broad sideways trend over the long term. In the near term, we have seen a bullish price reversal off the 12.85 support level and from oversold territory. 14.70 becomes the initial resistance target from the move while a close below the 12.85 support level might be used as a stop loss indication.
To unlock meaningful gains, traders might hope to see a break above resistance (14.70), confirmed with a close, in which case 17.40 would become a further upside resistance target from the move.
IGA, may distribute information/research produced by its respective foreign affiliates within the IG Group of companies pursuant to an arrangement under Regulation 32C of the Financial Advisers Regulations. Where the research is distributed in Singapore to a person who is not an Accredited Investor, Expert Investor or an Institutional Investor, IGA accepts legal responsibility for the contents of the report to such persons only to the extent required by law. Singapore recipients should contact IGA at 6390 5118 for matters arising from, or in connection with the information distributed.
The information/research herein is prepared by IG Asia Pte Ltd (IGA) and its foreign affiliated companies (collectively known as the IG Group) and is intended for general circulation only. It does not take into account the specific investment objectives, financial situation, or particular needs of any particular person. You should take into account your specific investment objectives, financial situation, and particular needs before making a commitment to trade, including seeking advice from an independent financial adviser regarding the suitability of the investment, under a separate engagement, as you deem fit.
No representation or warranty is given as to the accuracy or completeness of this information. Consequently, any person acting on it does so entirely at their own risk. Please see important Research Disclaimer.
Please also note that the information does not contain a record of our trading prices, or an offer of, or solicitation for, a transaction in any financial instrument. Any views and opinions expressed may be changed without an update.
Live prices on most popular markets
- Forex
- Shares
- Indices
See more forex live prices
See more shares live prices
Prices above are subject to our website terms and agreements. Prices are indicative only. All shares prices are delayed by at least 15 mins.
See more indices live prices
Prices above are subject to our website terms and agreements. Prices are indicative only. All shares prices are delayed by at least 20 mins.
