AMD under pressure as Washington ramps up China export rules
AMD’s stock fell briefly yesterday on news that the US government will not allow the company to sell certain chips without an export license.

Washington tightens the rules on chip exports
U.S. officials have told AMD it cannot sell an AI chip tailored for Chinese customers without an export license, ensnaring the chipmaker in Washington's crackdown on tech exports to China. AMD had hoped to get approval to sell the lower-performance chip to Chinese buyers since it operates below AMD's offerings outside China.
AMD has declined to comment on whether it will seek the required license. AMD's shares fell 2.2% Tuesday amid investor concerns over potential impact on its China business, though the shares rebounded by the end of the session.
The U.S. unveiled export curbs in 2022 to limit China's access to advanced chips and chipmaking tools over national security worries. Controls were tightened further in October 2022 to cover more tech. Like AMD, Nvidia has downgraded performance of AI chips for the Chinese market to comply with escalating U.S. restrictions.
Major Chinese tech firms like Tencent and Baidu have stockpiled Nvidia's powerful pre-ban AI chips to sustain development for 1-2 years. Huawei is developing its own AI chips to fill potential gaps from the U.S. ban.
The Biden administration's intensifying efforts force AMD, Nvidia to navigate complex export rules that risk impacting a major market.
AMD stock price – technical analysis
The AMD share price, which has risen by nearly 50% year-to-date, accelerated to the upside last week and added around 15% of gains since last Thursday.
AMD Daily Candlestick Chart
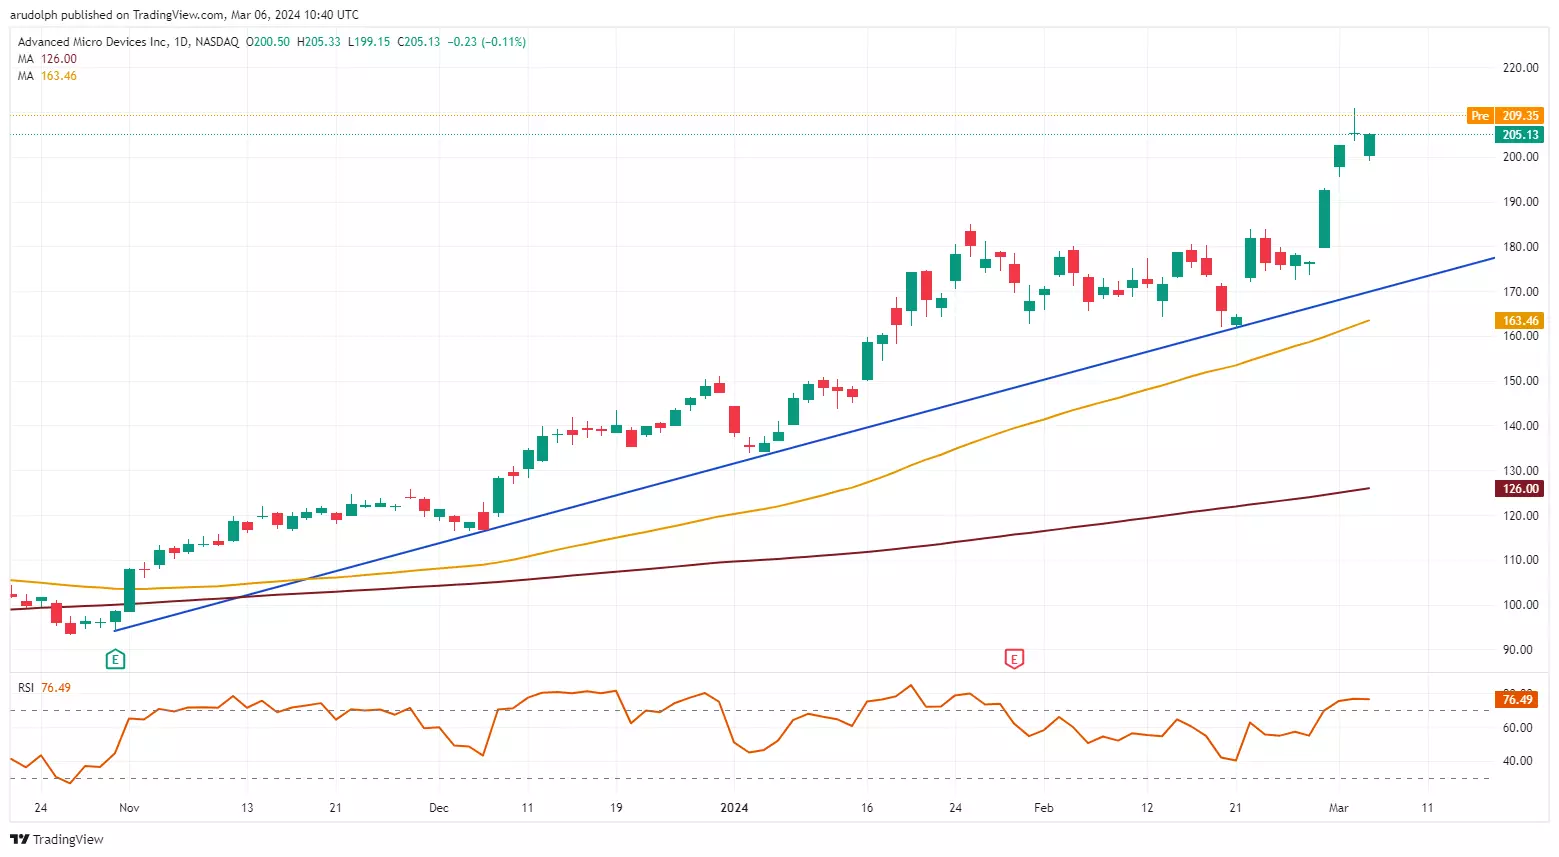
The fact that the last few days’ swift rally occurred while three price gaps were made, one of which has been filled on Tuesday, does mean that the current advance might be fragile as it seems to be driven by investors who jump on the bandwagon for fear of missing out.
Having said that, even if a short-term retracement lower were to be seen, the mid-January to late February $184.92 to $161.81 sideways trading range should offer solid support.
While it and the October-to-March uptrend line underpin, the medium-term uptrend will remain valid.
A rise above Tuesday’s $211.01 record high would put the minor psychological $250 mark on the cards.
IGA, may distribute information/research produced by its respective foreign affiliates within the IG Group of companies pursuant to an arrangement under Regulation 32C of the Financial Advisers Regulations. Where the research is distributed in Singapore to a person who is not an Accredited Investor, Expert Investor or an Institutional Investor, IGA accepts legal responsibility for the contents of the report to such persons only to the extent required by law. Singapore recipients should contact IGA at 6390 5118 for matters arising from, or in connection with the information distributed.
The information/research herein is prepared by IG Asia Pte Ltd (IGA) and its foreign affiliated companies (collectively known as the IG Group) and is intended for general circulation only. It does not take into account the specific investment objectives, financial situation, or particular needs of any particular person. You should take into account your specific investment objectives, financial situation, and particular needs before making a commitment to trade, including seeking advice from an independent financial adviser regarding the suitability of the investment, under a separate engagement, as you deem fit.
No representation or warranty is given as to the accuracy or completeness of this information. Consequently, any person acting on it does so entirely at their own risk. Please see important Research Disclaimer.
Please also note that the information does not contain a record of our trading prices, or an offer of, or solicitation for, a transaction in any financial instrument. Any views and opinions expressed may be changed without an update.

Seize a share opportunity today
Go long or short on thousands of international stocks.
- Increase your market exposure with leverage
- Get spreads from just 0.1% on major global shares
- Trade CFDs straight into order books with direct market access
Live prices on most popular markets
- Forex
- Shares
- Indices
See more forex live prices
See more shares live prices
Prices above are subject to our website terms and agreements. Prices are indicative only. All shares prices are delayed by at least 15 mins.
See more indices live prices
Prices above are subject to our website terms and agreements. Prices are indicative only. All shares prices are delayed by at least 20 mins.
