Q2 FTSE 100 fundamental and technical outlook
Can the FTSE 100 break through the 8,000 barrier?

Q2 2024 fundamental and technical outlook
UK stocks see surge in takeover bids but the FTSE 100 continues to underperform
UK companies have become prime targets for acquisitive firms, as Brexit-driven weakness in British markets creates favourable conditions for takeover bids with lofty premiums. However, some British companies are resisting these purportedly generous offers, setting up a tug-of-war as bidders attempt to seize undervalued assets.
The undervaluation is striking: the FTSE 350 trades at a record 40% discount to global equities on a forward price-to-earnings (P/E) basis. By the enterprise value-to-EBITDA metric often used to value deals, the gap widens to around 50%. This low valuation has sparked a flood of bids with median premiums around 34% - near the highest since 2018's mergers and acquisitions boom.
Deal flow rising
So far in 2024, there have already been 12 bids above £100 million market capitalization, versus just 5 at this time last year. Several deals like Wincanton's sale to GXO Logistics have seen premiums over 100%. More bids may come as the economic outlook improves and interest rates likely fall.
UK managers see undervaluation but FTSE 100 continues to underperfom
Despite UK management teams agreeing that their shares are underpriced, as evidenced by high rates of buybacks amid low equity issuance, the FTSE 100 continues to underperform its US peers. According to Goldman Sachs almost all UK sectors are cheaper than their US counterparts, yet the FTSE 100 trails its US peers by a large margin.
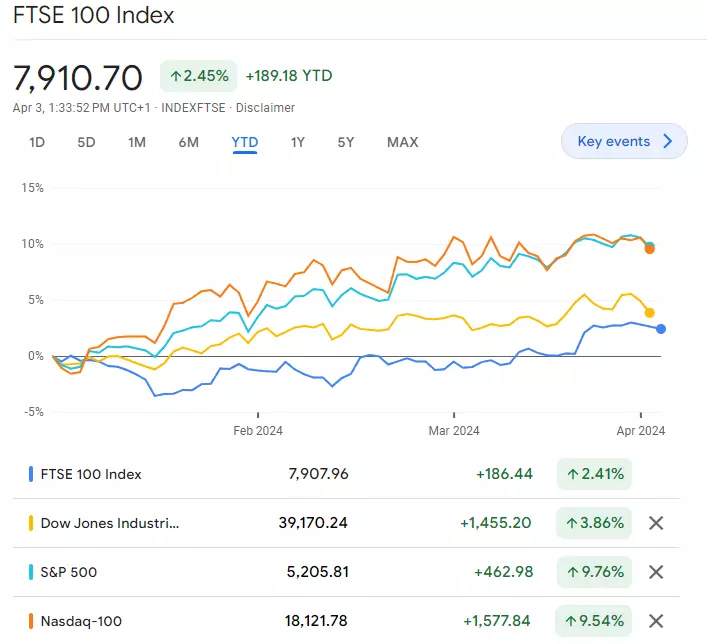
Whereas the FTSE 100 has only risen by up to 3% year-to-date, the S&P 500 and Nasdaq 100 hit over 10% gains earlier this week before taking a breather.
FTSE 100 underperformance versus European peers
Compared to German and French stock markets, which also trade at a discount versus their US counterparts, the FTSE 100 has done poorly in first quarter (Q1) 2024.
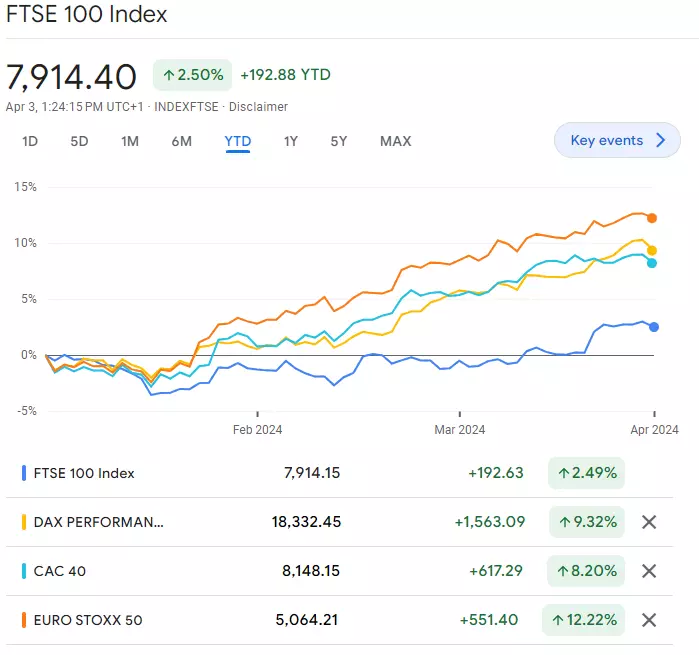
As of 03 April 2024 the CAC 40 was up around 8%, the DAX 40 over 9% and the Euro Stoxx 50 up over 12%, outstripping gains by its US peers. The FTSE 100 only managed a meagre 2.5% gain, though, as investors stay away from the UK stock index.
Perhaps Brexit is part of the reason for the FTSE 100’s underperformance, perhaps the high percentage of energy and mining stocks or the lack of technology or AI stocks within the index, but the fact remains that the UK blue chip index is simply not doing as well as its European and US counterparts.
Even if the UK economy were to rapidly come out of its, for now, shallow recession and even if the uncertainty regarding this year’s election were out of the way, it is hard to see how the FTSE 100 could meaningfully catch up with its peers, despite its current extreme undervaluation.
If the UK economy were to improve drastically, things could change but such a scenario is unlikely to be seen before the latter half of this year, once the UK election has taken place.
Q2 FTSE 100 technical outlook
In early-April investors were hoping that the FTSE 100 could finally break through its psychological 8,000 barrier but once again to no avail.
Having intraday traded above the 8,000 level over two consecutive days in early-April, the UK blue chip index once again reversed its short-term trend and fell towards its key 7,785 to 7,749 support zone which consists of the September-to-mid-March highs.
It was the break through this previous major resistance area in late-March on the back of the Bank of England’s (BoE) monthly meeting in which it struck a more dovish note, that investors believed that the FTSE 100 could finally break higher and sustain its gains.
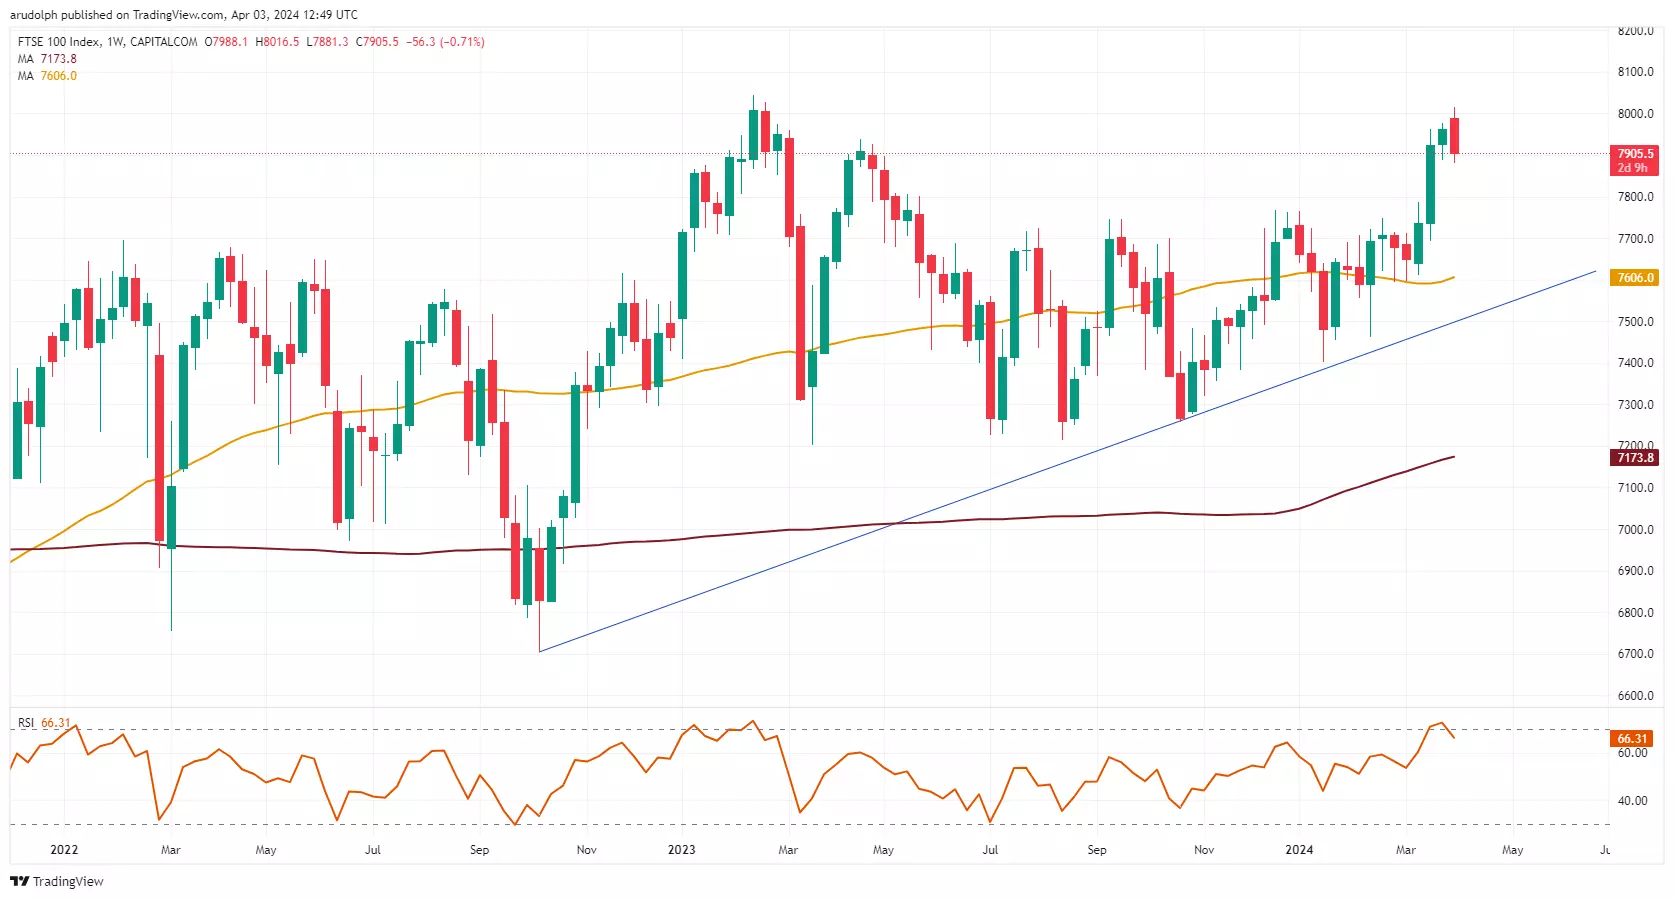
Such a longer-term bullish scenario may still play out, provided that the 7,785 to 7,749 support zone underpins, together with the late-February low at 7,594. As long as this is the case, the FTSE 100 should at least follow other global equity indices higher once the current corrective phase has run its course.
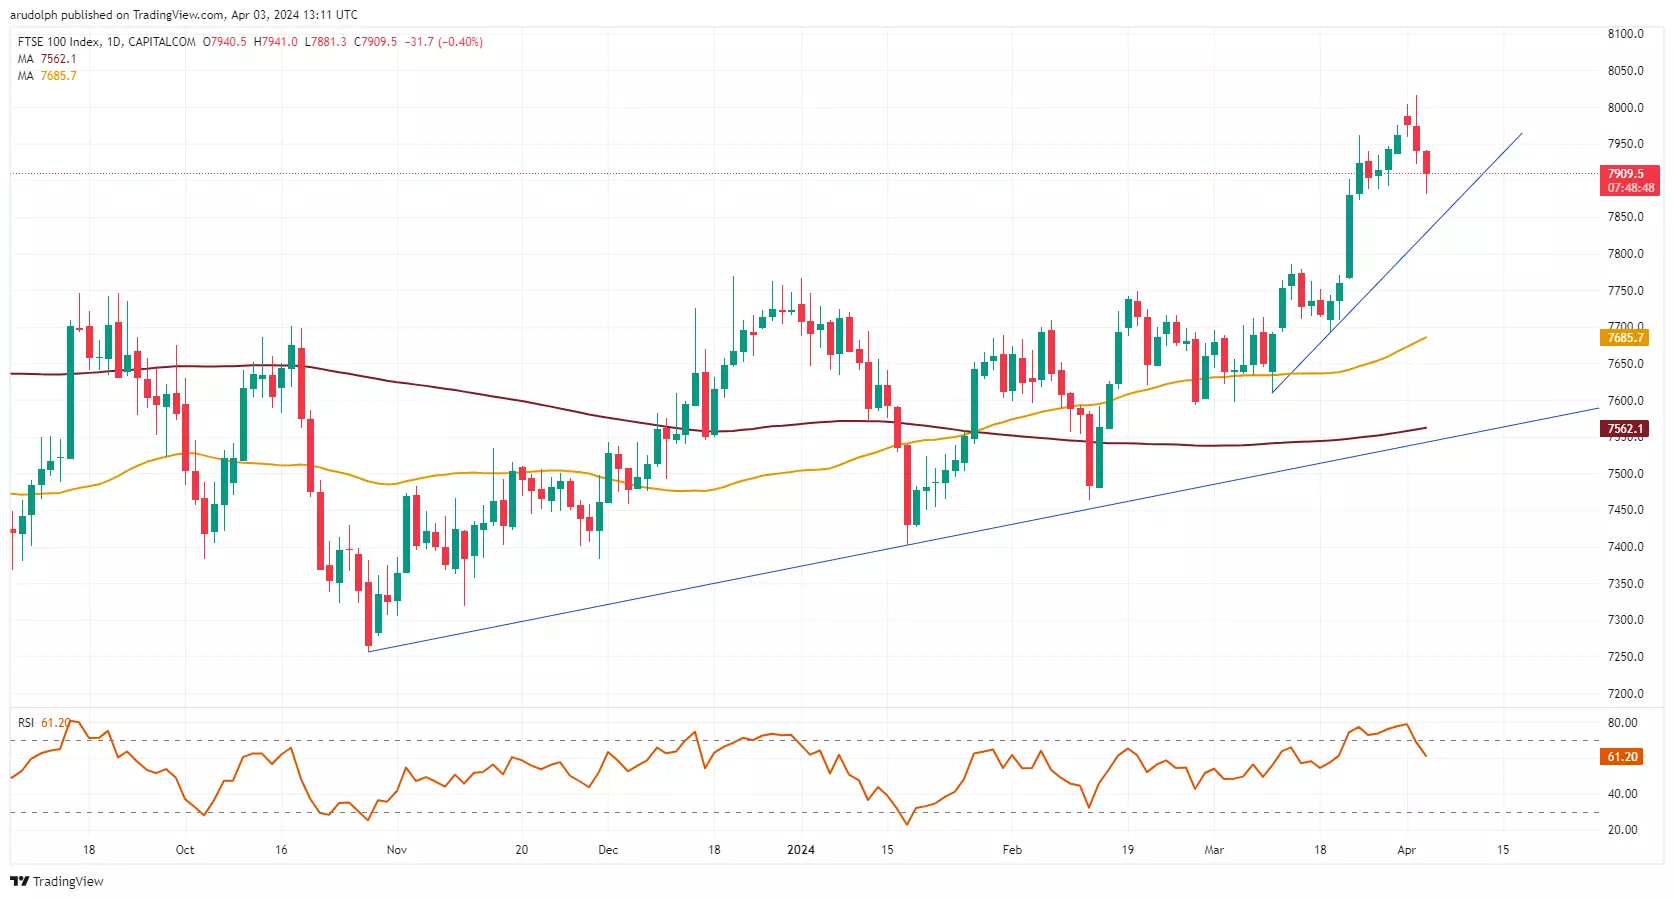
A rise above the current April high at 8,016 is expected to engage the February 2023 record high at 8,044. If exceeded, the 8,100 region would represent the next upside target for the FTSE 100.
IGA, may distribute information/research produced by its respective foreign affiliates within the IG Group of companies pursuant to an arrangement under Regulation 32C of the Financial Advisers Regulations. Where the research is distributed in Singapore to a person who is not an Accredited Investor, Expert Investor or an Institutional Investor, IGA accepts legal responsibility for the contents of the report to such persons only to the extent required by law. Singapore recipients should contact IGA at 6390 5118 for matters arising from, or in connection with the information distributed.
The information/research herein is prepared by IG Asia Pte Ltd (IGA) and its foreign affiliated companies (collectively known as the IG Group) and is intended for general circulation only. It does not take into account the specific investment objectives, financial situation, or particular needs of any particular person. You should take into account your specific investment objectives, financial situation, and particular needs before making a commitment to trade, including seeking advice from an independent financial adviser regarding the suitability of the investment, under a separate engagement, as you deem fit.
No representation or warranty is given as to the accuracy or completeness of this information. Consequently, any person acting on it does so entirely at their own risk. Please see important Research Disclaimer.
Please also note that the information does not contain a record of our trading prices, or an offer of, or solicitation for, a transaction in any financial instrument. Any views and opinions expressed may be changed without an update.

Take a position on indices
Deal on the world’s major stock indices today.
- Trade the lowest Wall Street spreads on the market
- 1-point spread on the FTSE 100 and Germany 40
- The only provider to offer 24-hour pricing
Live prices on most popular markets
- Forex
- Shares
- Indices
See more forex live prices
See more shares live prices
Prices above are subject to our website terms and agreements. Prices are indicative only. All shares prices are delayed by at least 15 mins.
See more indices live prices
Prices above are subject to our website terms and agreements. Prices are indicative only. All shares prices are delayed by at least 20 mins.
