EUR/USD, EUR/GBP and GBP/USD consolidate
Outlook on EUR/USD, EUR/GBP and GBP/USD ahead of UK inflation data releases

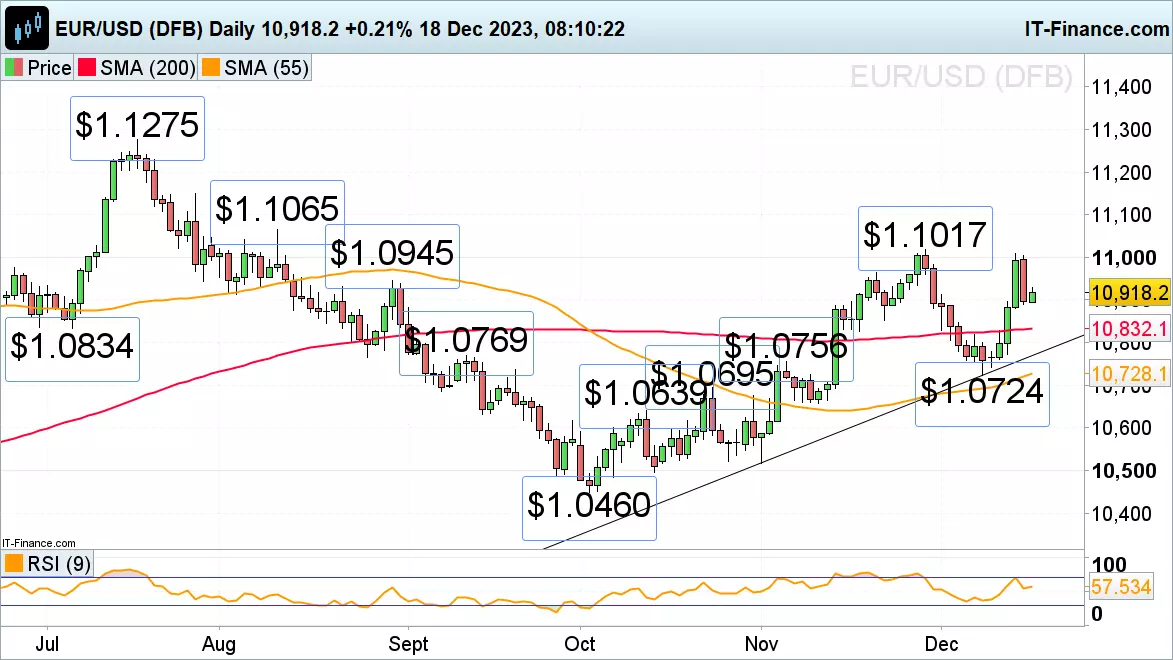
EUR/USD consolidates below November and December peaks
Last week EUR/USD topped out at $1.1009, marginally below its November peak at $1.1017, as comments by European Central Bank (ECB) president Christine Lagarde, in which she said interest rate cuts had not been discussed during the last week’s policy meeting, provoked a sell-off.
EUR/USD thus dropped back below its late August high at $1.0945 to $1.0889. Further minor support is seen around the 14 November high at $1.0887 and the 22 November low at $1.0852. Only a rise above $1.1009 to $1.1017 would put the 10 August high at $1.1065 on the map.
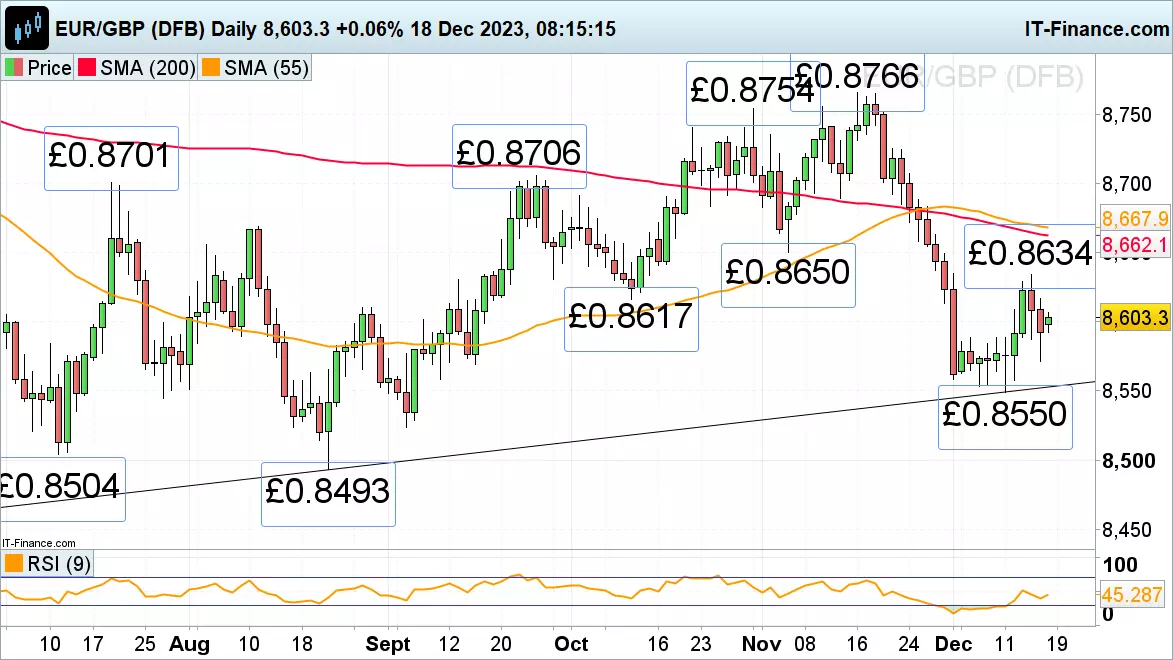
EUR/GBP trades around the £0.8600 mark
EUR/GBP’s drop from Thursday’s £0.8634 high to Friday’s £0.8572 low has been followed by a bounce back to the £0.86 region around which it is now trading ahead of Monday’s Germany Ifo business climate and Wednesday’s UK inflation Producer Price Index (PPI) and RPI data releases.
Resistance above £0.8634 is seen along the 200- and 55-day simple moving averages (SMA) at £0.8662 to £0.8668 and support below Friday’s £0.8572 low around the current December trough at £0.855.
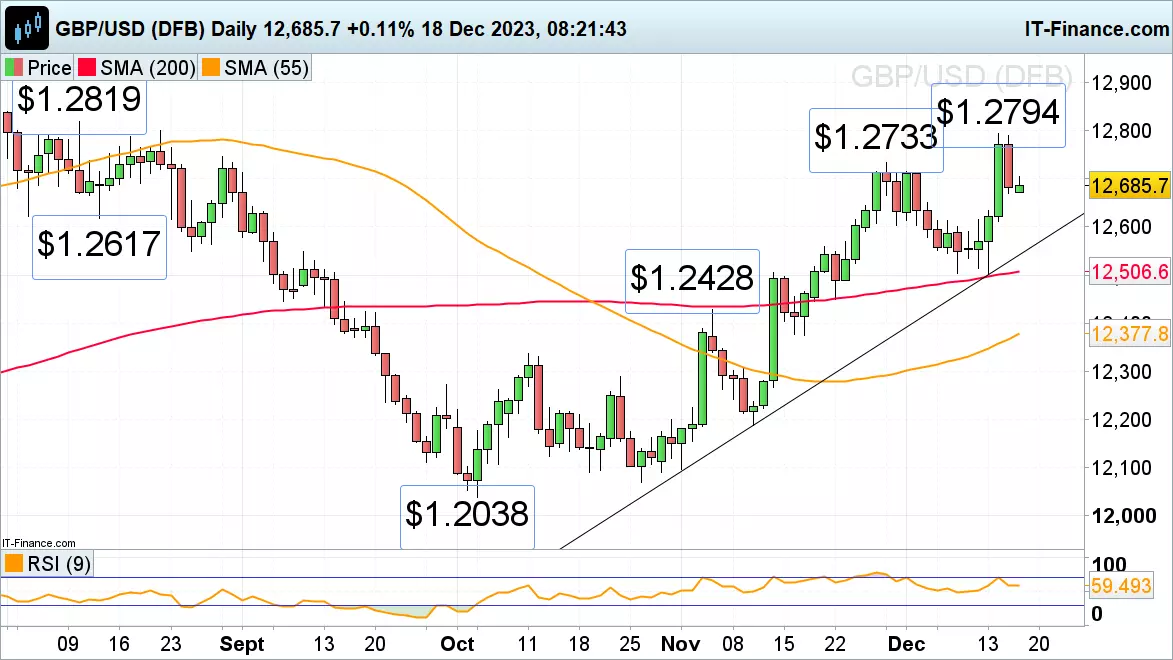
GBP/USD comes off last week’s near four-month high
GBP/USD, which last week rose to a near four-month high at $1.2794, is seen slipping towards its $1.2617 mid-August low amid negative divergence on the daily Relative Strength Index (RSI), pointing to a potential retracement lower soon being witnessed.
Below $1.2617 the November-to-December uptrend line can be found at $1.2542. Resistance sits at the November and current December highs at $1.2733 to $1.2794. If overcome, the 10 August high at $1.2819 would be eyed next.
IGA, may distribute information/research produced by its respective foreign affiliates within the IG Group of companies pursuant to an arrangement under Regulation 32C of the Financial Advisers Regulations. Where the research is distributed in Singapore to a person who is not an Accredited Investor, Expert Investor or an Institutional Investor, IGA accepts legal responsibility for the contents of the report to such persons only to the extent required by law. Singapore recipients should contact IGA at 6390 5118 for matters arising from, or in connection with the information distributed.
The information/research herein is prepared by IG Asia Pte Ltd (IGA) and its foreign affiliated companies (collectively known as the IG Group) and is intended for general circulation only. It does not take into account the specific investment objectives, financial situation, or particular needs of any particular person. You should take into account your specific investment objectives, financial situation, and particular needs before making a commitment to trade, including seeking advice from an independent financial adviser regarding the suitability of the investment, under a separate engagement, as you deem fit.
No representation or warranty is given as to the accuracy or completeness of this information. Consequently, any person acting on it does so entirely at their own risk. Please see important Research Disclaimer.
Please also note that the information does not contain a record of our trading prices, or an offer of, or solicitation for, a transaction in any financial instrument. Any views and opinions expressed may be changed without an update.

Start trading forex today
Trade the largest and most volatile financial market in the world.
- Spreads start at just 0.6 points on EUR/USD
- Analyse market movements with our essential selection of charts
- Speculate from a range of platforms, including on mobile
Live prices on most popular markets
- Forex
- Shares
- Indices
See more forex live prices
See more shares live prices
Prices above are subject to our website terms and agreements. Prices are indicative only. All shares prices are delayed by at least 15 mins.
See more indices live prices
Prices above are subject to our website terms and agreements. Prices are indicative only. All shares prices are delayed by at least 20 mins.
