Apple Stock Selloff: Has the Worst Passed?
Apple’s stock dropped in Q1, but the longer-term growth story remains intact.

Steep Slide Erodes Market Value
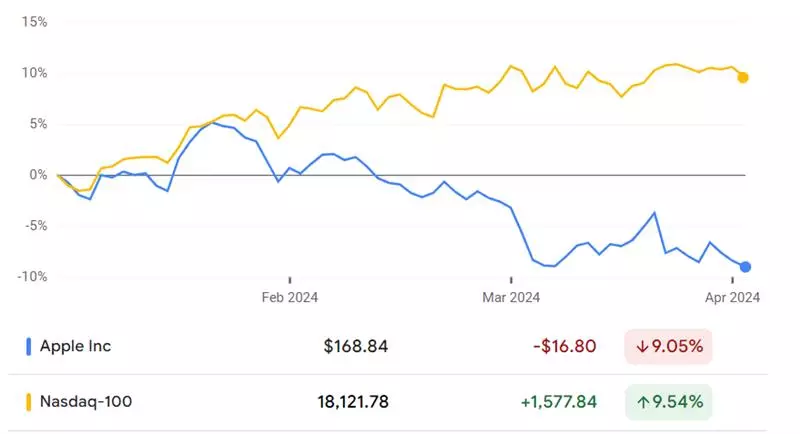
Apple’s stock has suffered its worst quarterly performance relative to the S&P 500 Index in over a decade, dropping 9% year-to-date. This steep slide has erased more than $300 billion in market value, causing Apple to cede its position as the most valuable US company to Microsoft. The decline was spurred by declining sales in China, regulatory scrutiny of its App store, and mounting concern among investors about its growth outlook.
Short Sellers May Unwind Positions
Short sellers pounced on Apple as peers like Nvidia, Meta, and Amazon kept rallying. Apple is the second-most profitable short position this year at $2.4 billion in paper profits, according to data-analytics firm S3 Partners. That may give them some incentive to unwind the positions, potentially providing some upside for the stock.
Strong Fundamentals and Safe-Haven Appeal
Despite the challenges, Apple's strong cash flows, buybacks, and reputation as a safe-haven stock suggest the downside may be limited from current levels. The company's massive buyback plans mean its shares continue to have upside potential for long-term money managers.
Potential Rotation from Frothy Tech Names
If the AI-driven tech rally fades, some traders expect a rotation back into Apple from frothier tech names like Nvidia. While anxiety is building over how long the artificial intelligence euphoria can last following Nvidia's over 80% surge in 2024, Apple shouldn't be a drag on the S&P 500 unless it breaks its multi-year uptrend from its 2020 lows.
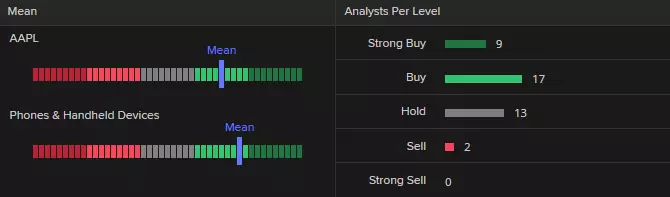
Apple analyst ratings
Fundamental analysts are rating Apple as between a ‘buy’ with LSEG data showing 9 strong buy, 17 buy, 13 hold, and 2 sell - with the mean of estimates suggesting a long-term price target of $200 for the share, roughly 18% above the share’s current price (as of 3 April 2024).
Technical analysis on the Apple share price
The Apple share price topped out in December of last year, having already done so in July, and has been coming off its $196.38 late-January high over the past few months with it slipping towards its October 2023 low at $165.67.
The October low is technically key as a fall through it would form a long-term double top formation which could lead to the 200-week simple moving average (SMA) at $151.21 being reached in the course of this year.
Apple Weekly Candlestick Chart
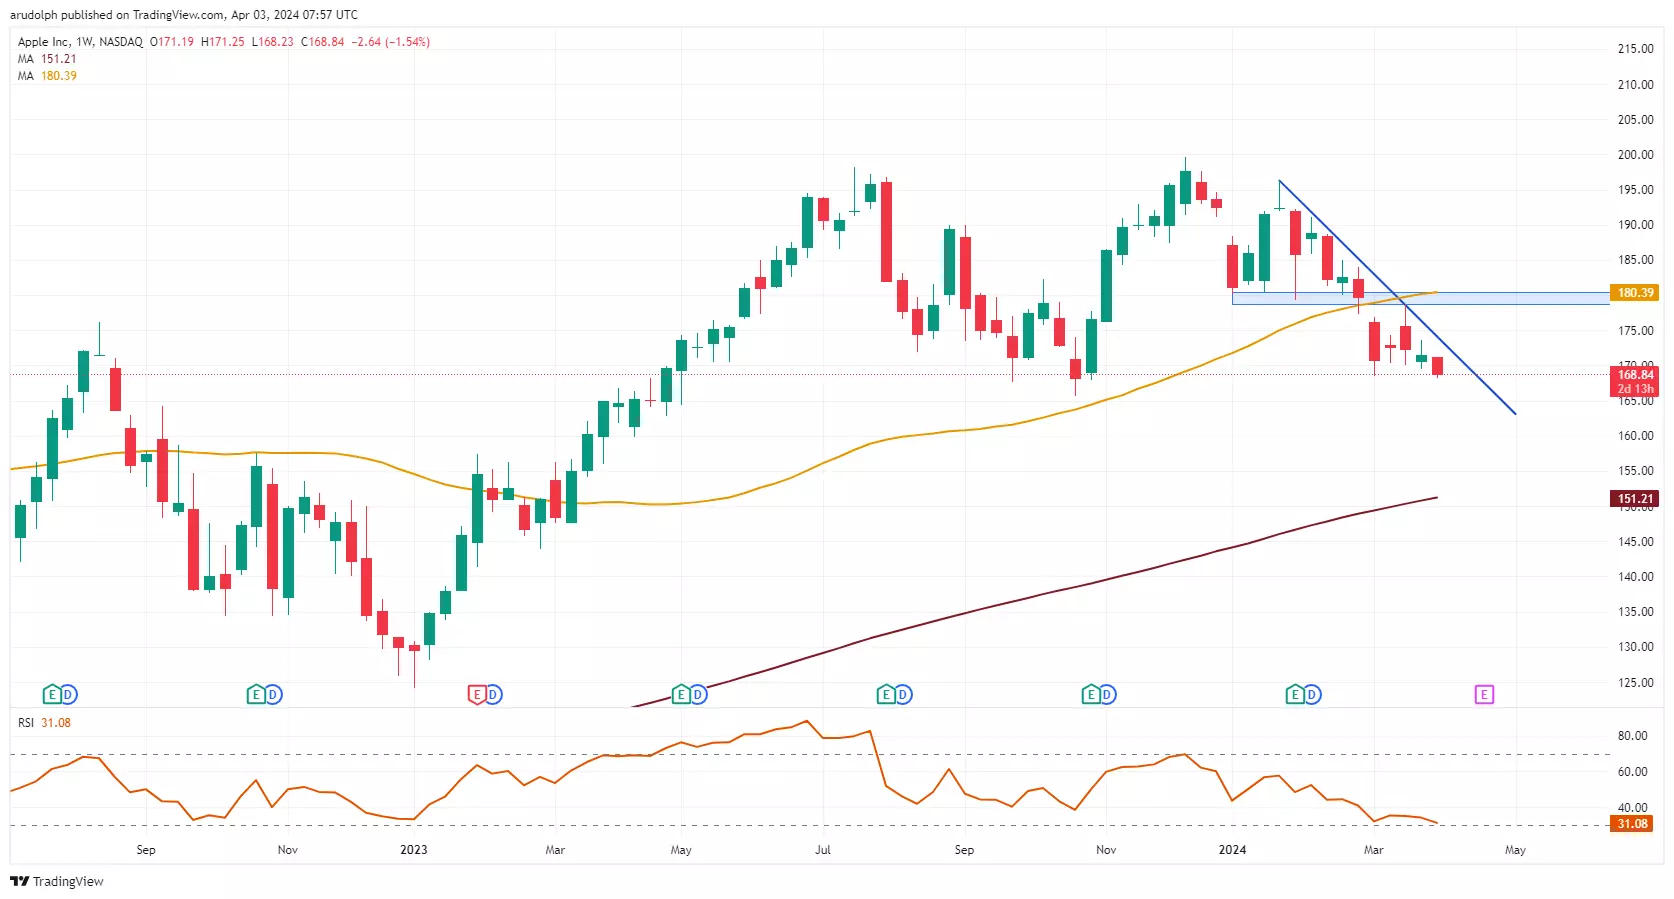
The risk of such a decline unfolding will remain in play while the January lows and 55-week SMA at $179.25 to $180.39 thwart any upside bounce. In mid-March this key resistance zone already capped the upside and failure there provoked the current descent with the March low at $168.49 being revisited.
Apple Daily Candlestick Chart
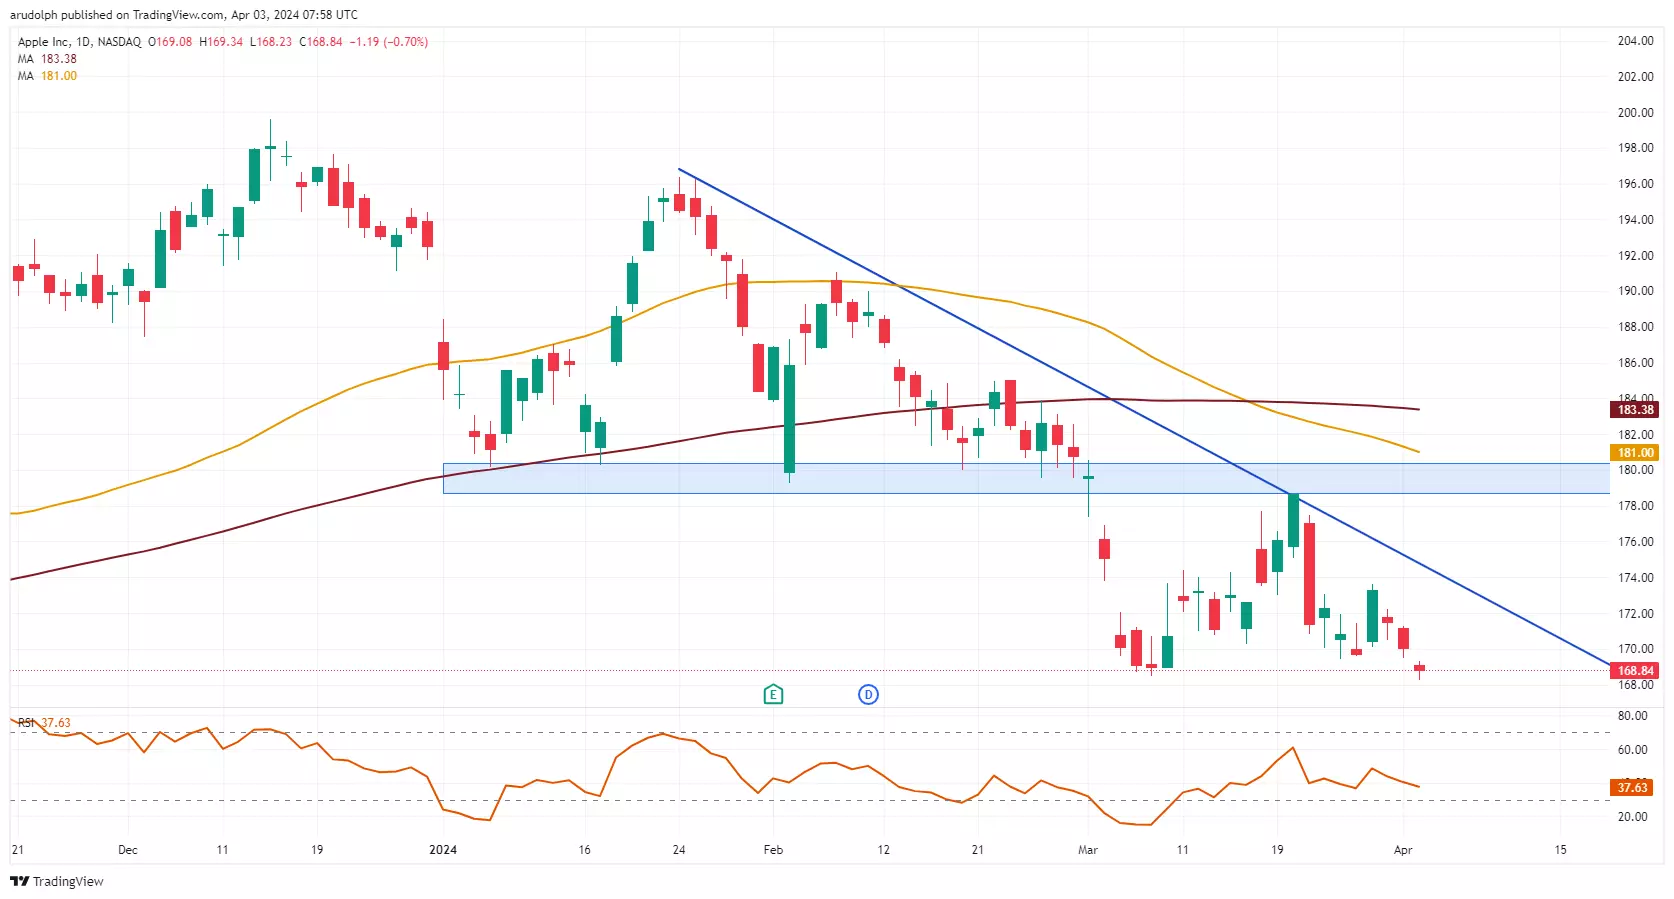
A fall through and daily chart close below the $168.49 March low would engage the October 2023 low at $165.67 below which would then beckon the minor psychological $150 region.
Resistance can be seen at last Wednesday’s $173.60 reaction high and along this year’s downtrend line at $174.80. While no rise above $173.60 is seen, downside pressure should prevail.
IGA, may distribute information/research produced by its respective foreign affiliates within the IG Group of companies pursuant to an arrangement under Regulation 32C of the Financial Advisers Regulations. Where the research is distributed in Singapore to a person who is not an Accredited Investor, Expert Investor or an Institutional Investor, IGA accepts legal responsibility for the contents of the report to such persons only to the extent required by law. Singapore recipients should contact IGA at 6390 5118 for matters arising from, or in connection with the information distributed.
The information/research herein is prepared by IG Asia Pte Ltd (IGA) and its foreign affiliated companies (collectively known as the IG Group) and is intended for general circulation only. It does not take into account the specific investment objectives, financial situation, or particular needs of any particular person. You should take into account your specific investment objectives, financial situation, and particular needs before making a commitment to trade, including seeking advice from an independent financial adviser regarding the suitability of the investment, under a separate engagement, as you deem fit.
No representation or warranty is given as to the accuracy or completeness of this information. Consequently, any person acting on it does so entirely at their own risk. Please see important Research Disclaimer.
Please also note that the information does not contain a record of our trading prices, or an offer of, or solicitation for, a transaction in any financial instrument. Any views and opinions expressed may be changed without an update.

Seize a share opportunity today
Go long or short on thousands of international stocks.
- Increase your market exposure with leverage
- Get spreads from just 0.1% on major global shares
- Trade CFDs straight into order books with direct market access
Live prices on most popular markets
- Forex
- Shares
- Indices
See more forex live prices
See more shares live prices
Prices above are subject to our website terms and agreements. Prices are indicative only. All shares prices are delayed by at least 15 mins.
See more indices live prices
Prices above are subject to our website terms and agreements. Prices are indicative only. All shares prices are delayed by at least 20 mins.
