What are the best chart indicators for trading?
Technical indicators can be a great help to traders looking for potential opportunities based on historical price trends and advanced calculations. Find the ten most popular indicators used by traders worldwide.
What is a chart indicator?
Chart indicators, or technical indicators, are mathematical calculations that can supplement candlestick price charts to help traders decide on positions. Each indicator intends to highlight chart patterns based on variables such as volatility, time, and price action.
Why trade forex using trading indicators?
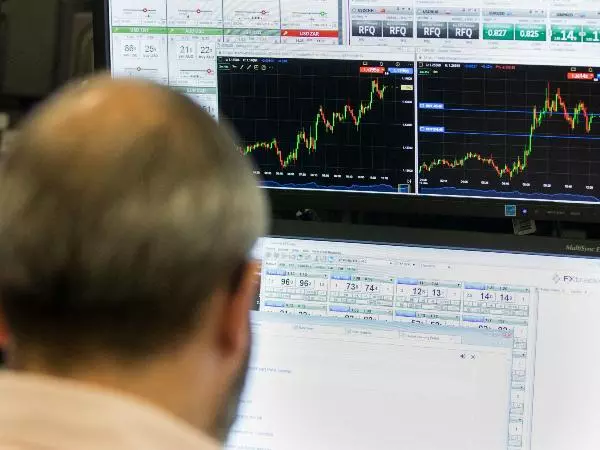
Advanced charting and technical analysis are popular with forex traders because currency pairs are traditionally mean reverting markets. Unlike stocks that tend to drift positively over time, many forex pairs have kept within the same historical range for decades at a time. This tendency allows traders to better speculate on price trends - citing historical bounds as context for price reversal or continuation. Forex markets also benefit from availability 24 hours a day, 5 days a week. In order to identify trends quickly, traders often rely on indicators and trading signals to efficiently highlight potential opportunities at all hours of the day.
10 most popular indicators for trading
1. Moving Average
Also known as the simple moving average (SMA), moving averages are a popular indicator that calculates the average price over a specific time period. It helps traders identify trends and potential support and resistance levels. MAs can provide support or resistance on their own, but many traders use two or more to identify crossovers - crossovers being the intersection of two MAs with different time horizons.

2. Exponential Moving Average (EMA)
Similar to the moving average, the EMA gives more weight to recent price data. It is particularly useful for short-term day traders looking for quick price movements.

3. Moving Average Convergence Divergence (MACD)
The MACD indicator uses two exponential moving averages of different timeframes to identify the strength of a directional move. This line is compared to a signal line that is an EMA of the MACD line. If the MACD line is above the signal line, the histogram will indicate bullish momentum; a signal line higher than the MACD then indicating bearish momentum. Traders can conversely use the histogram to gauge if a pair is overbought/oversold.

4. Stochastic Oscillator
The stochastic oscillator measures the current price relative to its price range over a specific time period. Its values are bound between 0 and 100 - many traders anticipate a trend reversal when this indicator is under 20 or over 80.

5. Bollinger Bands
Bollinger Bands consist of a moving average and two standard deviation lines around it. Shrinking bands imply lower volatility while widening bands indicate higher volatility. When the price moves outside of the banded range, trend followers may expect a continued breakout in that direction while contrarians might look for prices to revert back within the expected range.

6. Relative Strength Index (RSI)
The RSI measures the strength and speed of price movements. It is a momentum indicator that attempts to highlight overbought or oversold levels. Like Stochastic Oscillator, RSI is bound by 0 and 100, but traders tend to anticipate potential trend reversals at levels below 30 or above 70.

7. Fibonacci Retracement
Fibonacci retracement is a mathematical calculation based on the Fibonacci sequence providing likelihoods of retracement. It helps traders identify potential support and resistance levels based on historical price movements.

8. Standard Deviation
Standard deviation measures the variability of historical prices. It can help traders gauge market volatility and set appropriate stop-loss levels based on their desired time horizon.

9. Ichimoku Cloud
The Ichimoku Cloud is a complex indicator that uses a five-line system containing two lines that provide support and resistance while other trend lines can create buying and selling signals when they cross with the range lines. It incorporates moving averages, standard deviations, and other calculations.

10. Client Sentiment
IG client sentiment provides insights into the positioning of traders in a specific market. It measures the percentage of clients with long or short positions in given pair relative to total number of clients with open positions.

How to incorporate indicators into your trading
Each indicator above uses different calculations to highlight different trends in historical price changes. Some find greater success on short-term price charts for day trading, while others are better long-term trend indicators. Many traders will utilize multiple indicators for reassurance when making trading decisions. However, other traders can base their entire trading strategy around a single indicator.
While these indicators have proven to be useful for many traders, it's important to remember that no indicator is foolproof. False signals and changing market conditions can still lead to losses as any one indicator will not dictate future prices. They should be used in conjunction with other forms of discernment, such as fundamental analysis and price action. Traders should also consider the current market conditions and their individual trading strategy when integrating different indicators.
Practice trading forex using indicators
- Open an account to get started, or practice on a demo account
- Choose your forex trading platform
- Monitor pairs using different chart indicators
- Open and close positions on forex pairs
Trading forex requires an account with a forex provider like IG. Many traders watch major forex pairs like EUR/USD and USD/JPY, which can be found in IG's platform under the 'Major' pairs tab, for potential opportunities based on economic events such as inflation releases or interest rate decisions. Economic events can produce more volatility for forex pairs, which can mean greater potential profits and losses as risks can increase at these times.
You can help develop your forex trading strategies using resources like IG’s Trading Academy. Once your strategy is developed, you can follow the above steps to opening an account and getting started trading forex.
Your profit or loss is calculated according to your full position size. Leverage will magnify both your profits and losses. It’s important to manage your risks carefully as losses can exceed your deposit. Ensure you understand the risks and benefits associated with trading leveraged products before you start trading with them. Trade using money you’re comfortable losing.
This information has been prepared by IG, a trading name of IG US LLC. This material does not contain a record of our trading prices, or an offer of, or solicitation for, a transaction in any financial instrument. You should not treat any opinion expressed in this material as a specific inducement to make any investment or follow any strategy, but only as an expression of opinion. This material does not consider your investment objectives, financial situation or needs and is not intended as recommendations appropriate for you. No representation or warranty is given as to the accuracy or completeness of the above information. IG accepts no responsibility for any use that may be made of these comments and for any consequences that result. See our Summary Conflicts Policy, available on our website.

Start trading forex today
Trade 80+ currency pairs 24 hours a day, 5 days a week
- Spreads start at just 0.8 pips on EUR/USD
- Analyze market movements with our essential selection of charts
- Speculate from a range of platforms, including on mobile