16 candlestick patterns every trader should know
Candlestick patterns are used to predict the future direction of price movement. Discover 16 of the most common candlestick patterns and how you can use them to identify trading opportunities.
What is a candlestick?
A candlestick is a way of displaying information about an asset’s price movement. Candlestick charts are one of the most popular components of technical analysis, enabling traders to interpret price information quickly and from just a few price bars.
This article focuses on a daily chart, wherein each candlestick details a single day’s trading. It has three basic features:
- The body, which represents the open-to-close range
- The wick, or shadow, that indicates the intra-day high and low
- The color, which reveals the direction of market movement – a green (or white) body indicates a price increase, while a red (or black) body shows a price decrease
Over time, individual candlesticks form patterns that traders can use to recognise major support and resistance levels. There are a great many candlestick patterns that indicate an opportunity within a market – some provide insight into the balance between buying and selling pressures, while others identify continuation patterns or market indecision.
Before you start trading, it’s important to familiarise yourself with the basics of candlestick patterns and how they can inform your decisions.
Six bullish candlestick patterns
Bullish patterns may form after a market downtrend, and signal a reversal of price movement. They are an indicator for traders to consider opening a long position to profit from any upward trajectory.
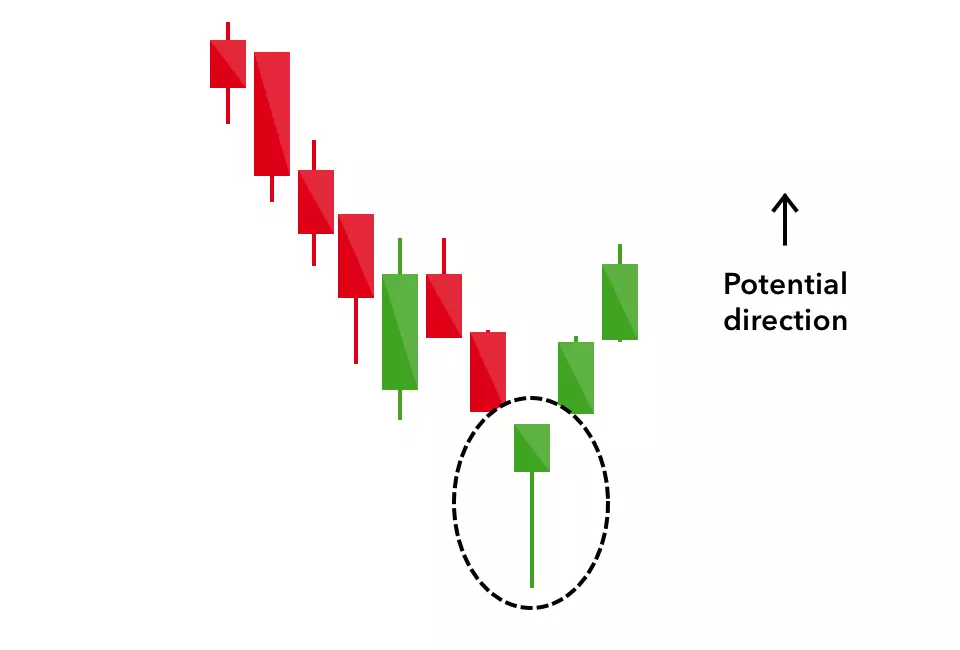
Hammer
The hammer candlestick pattern is formed of a short body with a long lower wick, and is found at the bottom of a downward trend.
A hammer shows that although there were selling pressures during the day, ultimately a strong buying pressure drove the price back up. The colour of the body can vary, but green hammers indicate a stronger bull market than red hammers.
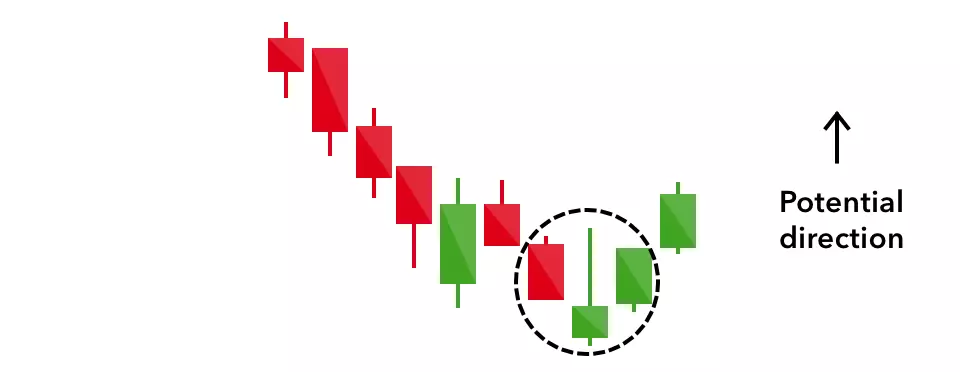
Inverse hammer
A similarly bullish pattern is the inverted hammer. The only difference being that the upper wick is long, while the lower wick is short.
It indicates a buying pressure, followed by a selling pressure that was not strong enough to drive the market price down. The inverse hammer suggests that buyers will soon have control of the market.
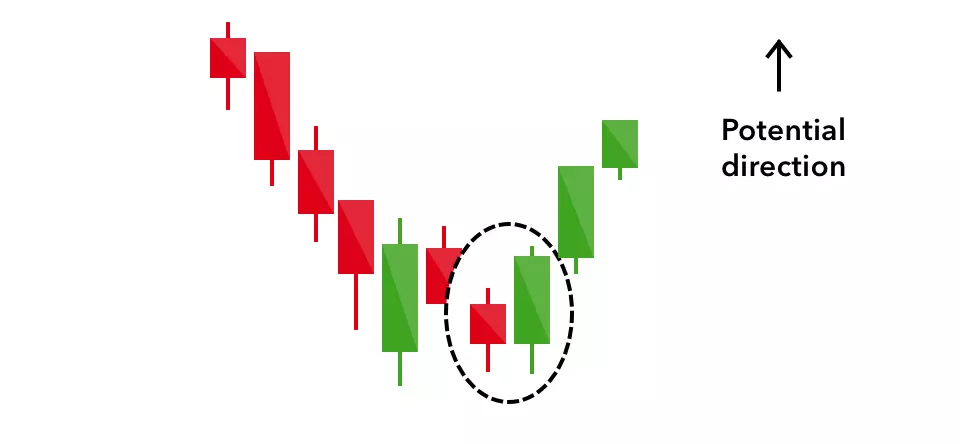
Bullish engulfing
The bullish engulfing pattern is formed of two candlesticks. The first candle is a short red body that is completely engulfed by a larger green candle.
Though the second day opens lower than the first, the bullish market pushes the price up, culminating in an obvious win for buyers.
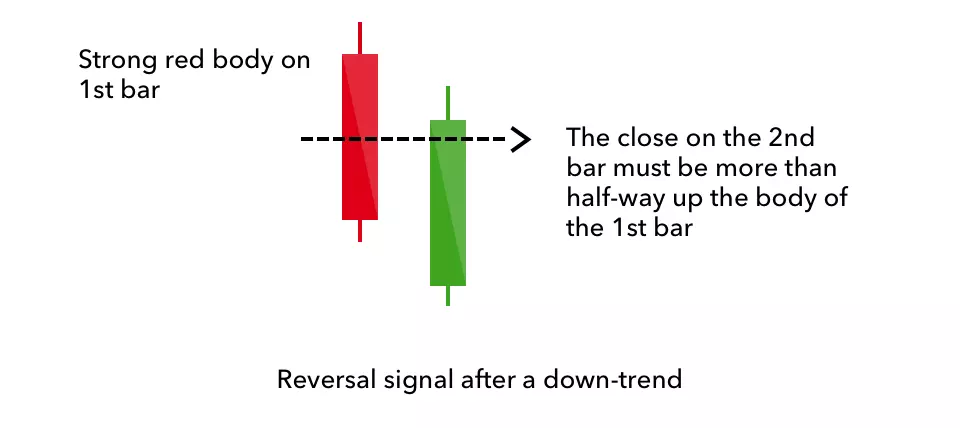
Piercing line
The piercing line is also a two-stick pattern, made up of a long red candle, followed by a long green candle.
There is usually a significant gap down between the first candlestick’s closing price, and the green candlestick’s opening. It indicates a strong buying pressure, as the price is pushed up to or above the mid-price of the previous day.
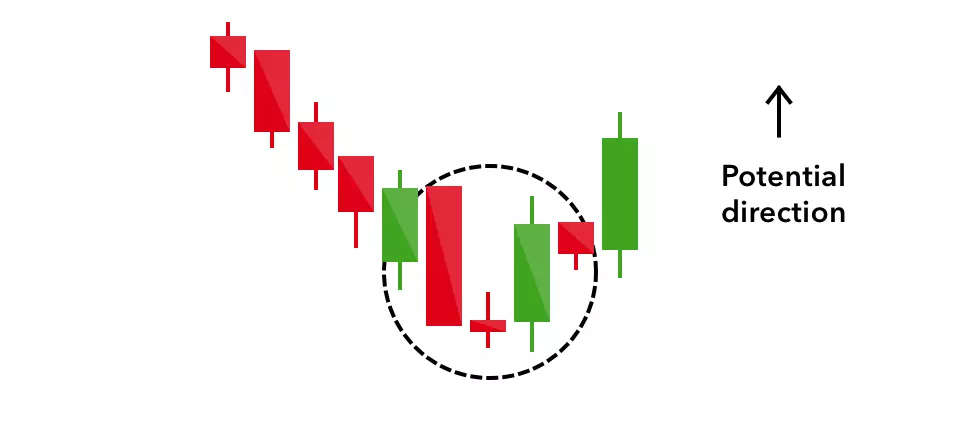
Morning star
The morning star candlestick pattern is considered a sign of hope in a bleak market downtrend. It is a three-stick pattern: one short-bodied candle between a long red and a long green. Traditionally, the ‘star’ will have no overlap with the longer bodies, as the market gaps both on open and close.
It signals that the selling pressure of the first day is subsiding, and a bull market is on the horizon.
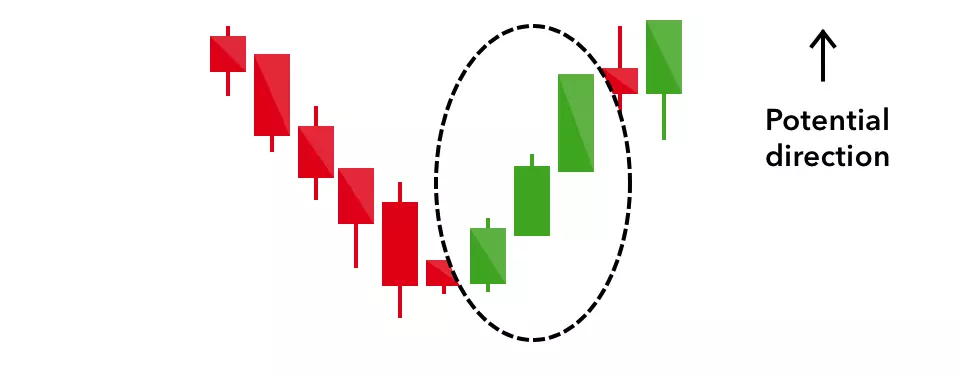
Three white soldiers
The three white soldiers pattern occurs over three days. It consists of consecutive long green (or white) candles with small wicks, which open and close progressively higher than the previous day.
It is a very strong bullish signal that occurs after a downtrend, and shows a steady advance of buying pressure.
Six bearish candlestick patterns
Bearish candlestick patterns usually form after an uptrend, and signal a point of resistance. Heavy pessimism about the market price often causes traders to close their long positions, and open a short position to take advantage of the falling price.
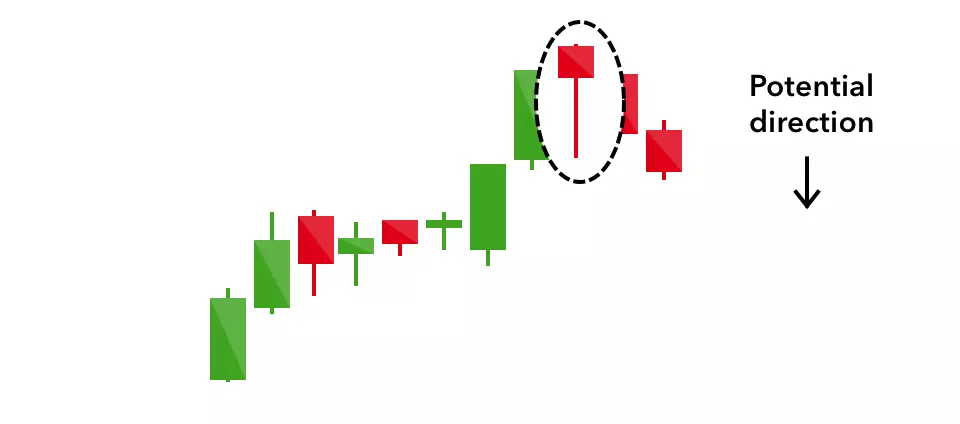
Hanging man
The hanging man is the bearish equivalent of a hammer; it has the same shape but forms at the end of an uptrend.
It indicates that there was a significant sell-off during the day, but that buyers were able to push the price up again. The large sell-off is often seen as an indication that the bulls are losing control of the market.
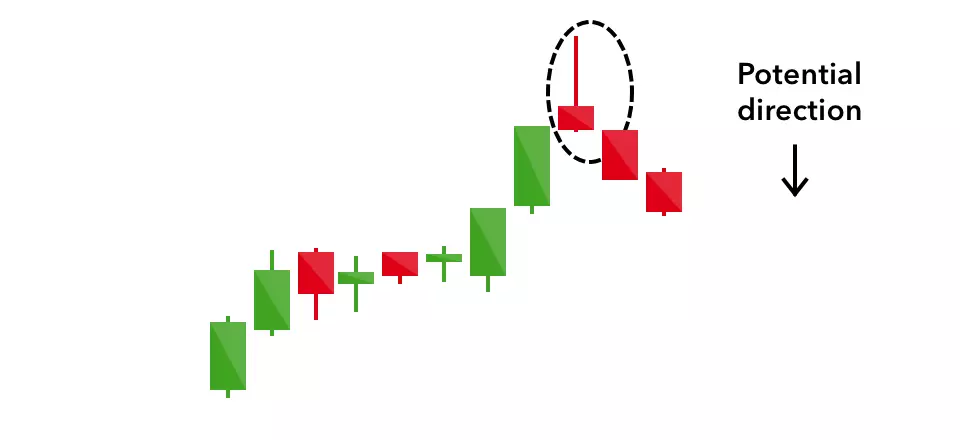
Shooting star
The shooting star is the same shape as the inverted hammer, but is formed in an uptrend: it has a small lower body, and a long upper wick.
Usually, the market will gap slightly higher on opening and rally to an intra-day high before closing at a price just above the open – like a star falling to the ground.
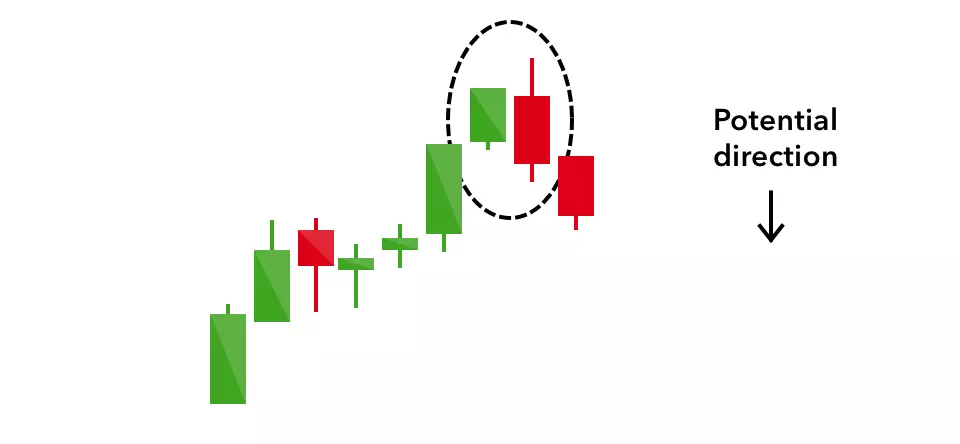
Bearish engulfing
A bearish engulfing pattern occurs at the end of an uptrend. The first candle has a small green body that is engulfed by a subsequent long red candle.
It signifies a peak or slowdown of price movement, and is a sign of an impending market downturn. The lower the second candle goes, the more significant the trend is likely to be.
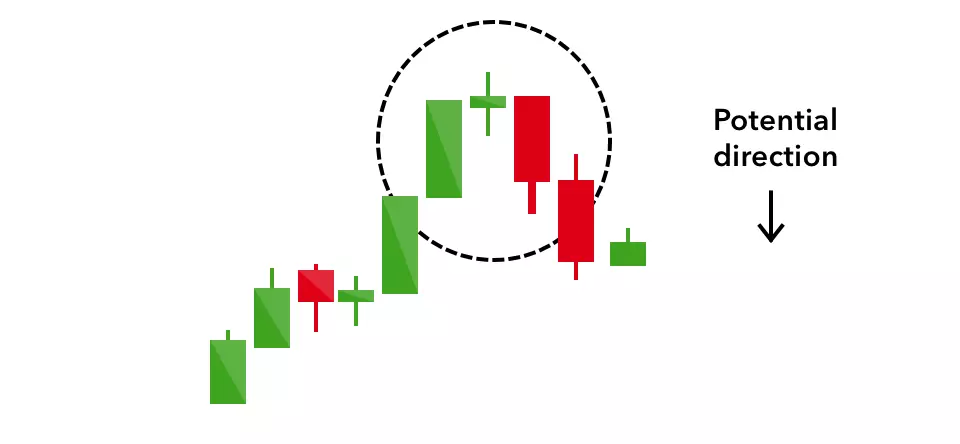
Evening star
The evening star is a three-candlestick pattern that is the equivalent of the bullish morning star. It is formed of a short candle sandwiched between a long green candle and a large red candlestick.
It indicates the reversal of an uptrend, and is particularly strong when the third candlestick erases the gains of the first candle.
Three black crows
The three black crows candlestick pattern comprises of three consecutive long red candles with short or non-existent wicks. Each session opens at a similar price to the previous day, but selling pressures push the price lower and lower with each close.
Traders interpret this pattern as the start of a bearish downtrend, as the sellers have overtaken the buyers during three successive trading days.
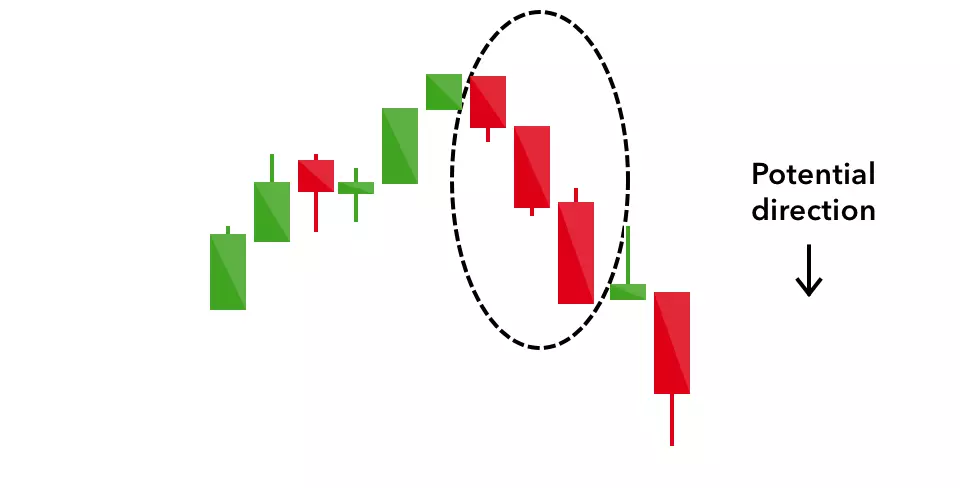
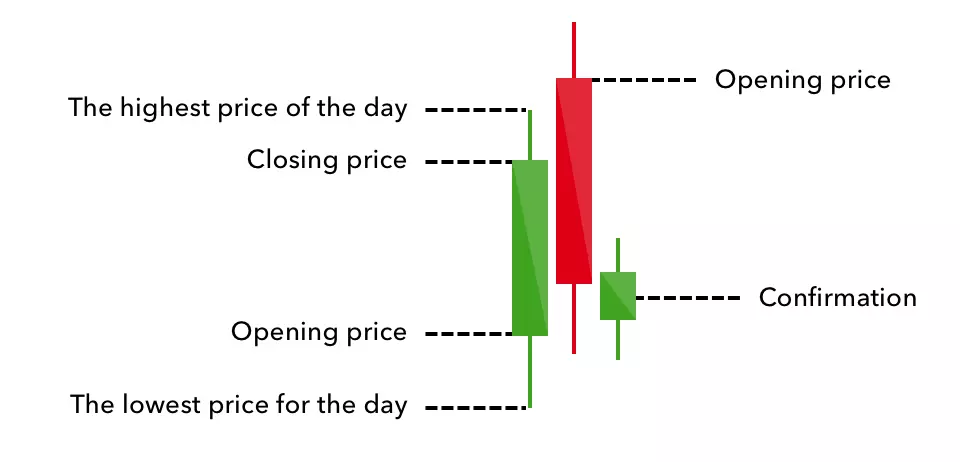
Dark cloud cover
The dark cloud cover candlestick pattern indicates a bearish reversal – a black cloud over the previous day’s optimism. It comprises two candlesticks: a red candlestick which opens above the previous green body, and closes below its midpoint.
It signals that the bears have taken over the session, pushing the price sharply lower. If the wicks of the candles are short it suggests that the downtrend was extremely decisive.
Four continuation candlestick patterns
If a candlestick pattern doesn’t indicate a change in market direction, it is what is known as a continuation pattern. These can help traders to identify a period of rest in the market, when there is market indecision or neutral price movement.
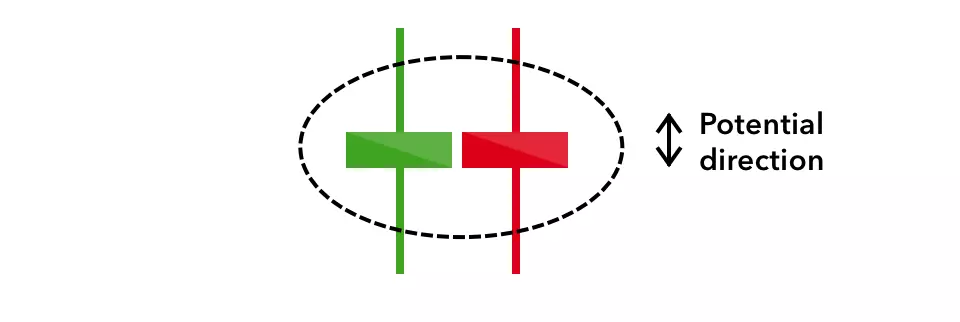
Doji
When a market’s open and close are almost at the same price point, the candlestick resembles a cross or plus sign – traders should look out for a short to non-existent body, with wicks of varying length.
This doji’s pattern conveys a struggle between buyers and sellers that results in no net gain for either side. Alone a doji is neutral signal, but it can be found in reversal patterns such as the bullish morning star and bearish evening star.
Spinning top
The spinning top candlestick pattern has a short body centred between wicks of equal length. The pattern indicates indecision in the market, resulting in no meaningful change in price: the bulls sent the price higher, while the bears pushed it low again. Spinning tops are often interpreted as a period of consolidation, or rest, following a significant uptrend or downtrend.
On its own the spinning top is a relatively benign signal, but they can be interpreted as a sign of things to come as it signifies that the current market pressure is losing control.
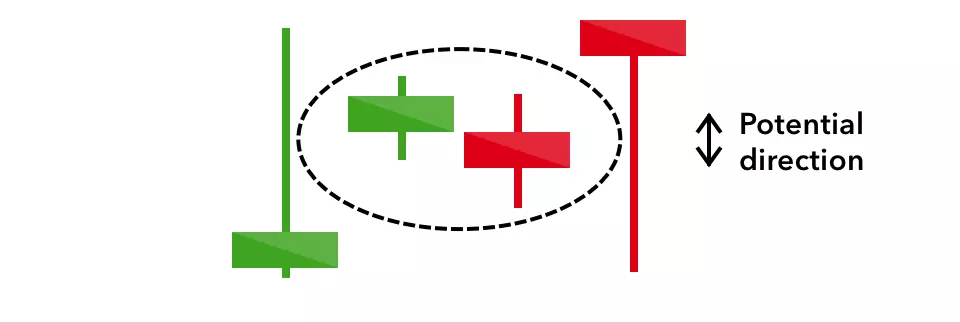
Falling three methods
Three-method formation patterns are used to predict the continuation of a current trend, be it bearish or bullish.
The bearish pattern is called the ‘falling three methods’. It is formed of a long red body, followed by three small green bodies, and another red body – the green candles are all contained within the range of the bearish bodies. It shows traders that the bulls do not have enough strength to reverse the trend.
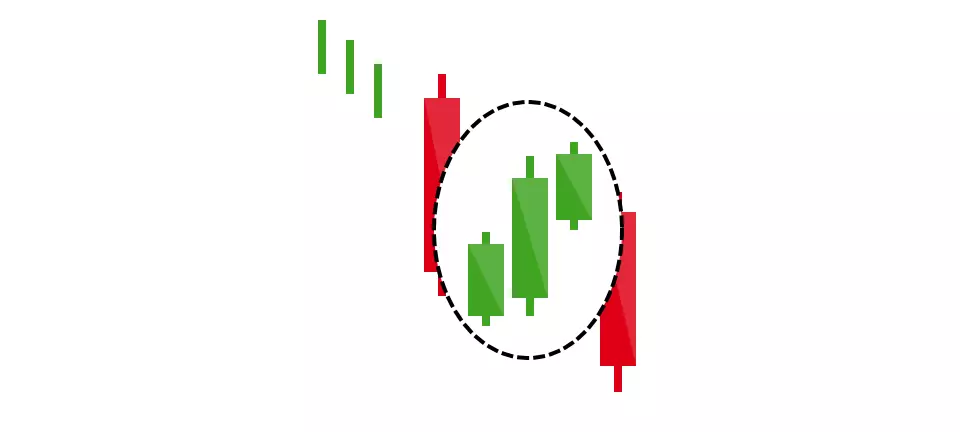
Rising three methods
The opposite is true for the bullish pattern, called the ‘rising three methods’ candlestick pattern. It comprises of three short reds sandwiched within the range of two long greens. The pattern shows traders that, despite some selling pressure, buyers are retaining control of the market.

Practise reading candlestick patterns
The best way to learn to read candlestick patterns is to practise entering and exiting trades from the signals they give. You can open an IG forex account and start to trade. If you don’t feel ready to trade on live markets, you can develop your skills in a risk-free environment by opening an IG demo account.
When using any candlestick pattern, it is important to remember that although they are great for quickly predicting trends, they should be used alongside other forms of technical analysis to confirm the overall trend.
Related articles
1. A trader’s guide to the stochastic oscillator
2. Leading and lagging indicators: what you need to know
This information has been prepared by IG, a trading name of IG US LLC. This material does not contain a record of our trading prices, or an offer of, or solicitation for, a transaction in any financial instrument. You should not treat any opinion expressed in this material as a specific inducement to make any investment or follow any strategy, but only as an expression of opinion. This material does not consider your investment objectives, financial situation or needs and is not intended as recommendations appropriate for you. No representation or warranty is given as to the accuracy or completeness of the above information. IG accepts no responsibility for any use that may be made of these comments and for any consequences that result. See our Summary Conflicts Policy, available on our website.

Develop your trading skills
Discover how to trade – or develop your knowledge – with free online courses, webinars and seminars.