The basics of technical analysis
Support and resistance
Support and resistance are the building blocks of technical analysis, and many effective trading strategies can be based solely around them. In simple terms, support and resistance are like glass floors and ceilings which appear to limit a market's range of movement.
The reason these levels appear is due to the balance between buyers and sellers, or demand and supply. When there are more buyers than sellers in a market (or more demand than supply) the price tends to rise. And when there are more sellers than buyers (or more supply than demand) the price tends to fall.
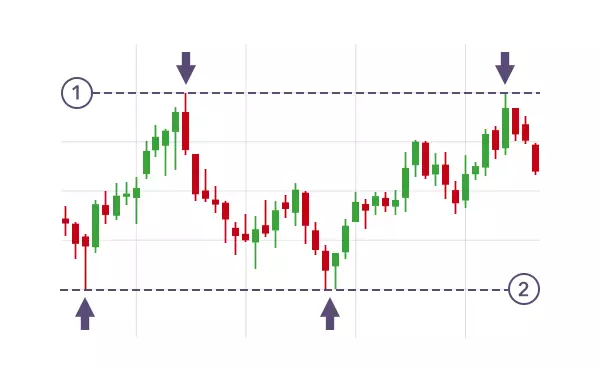
Support and resistance are the turning points. For example, a support level occurs when a market that's falling halts its decline to move higher. This typically means that the balance of market participants is moving from a seller's market to a buyer's market. The low point of the move is seen as a level of support.
Resistance is the opposite. It is a level where a rising price reverses downward as a shift in the balance of buyers to sellers pushes prices lower. The high point is the resistance level.
Question
Correct
Incorrect
Resistance is the ceiling that the price struggles to break through. Support is the floor where the price tends to stop declining.Finding support and resistance
Areas of support and resistance are relatively straightforward to plot on a chart, you just need to find a level the market has reached, but not been able to break through. The more times the market reaches that level, but fails to go through it, the stronger that level of support or resistance is said to be. In fact, major levels of support and resistance can often become psychological barriers, with many traders buying or selling as soon as that level is reached - which serves to reinforce the effect.
It's important to note that major support and resistance levels are rarely exact figures. It's unusual for a market to hit exactly the same price time after time before reversing, so it's probably more useful to think of them as support or resistance zones.
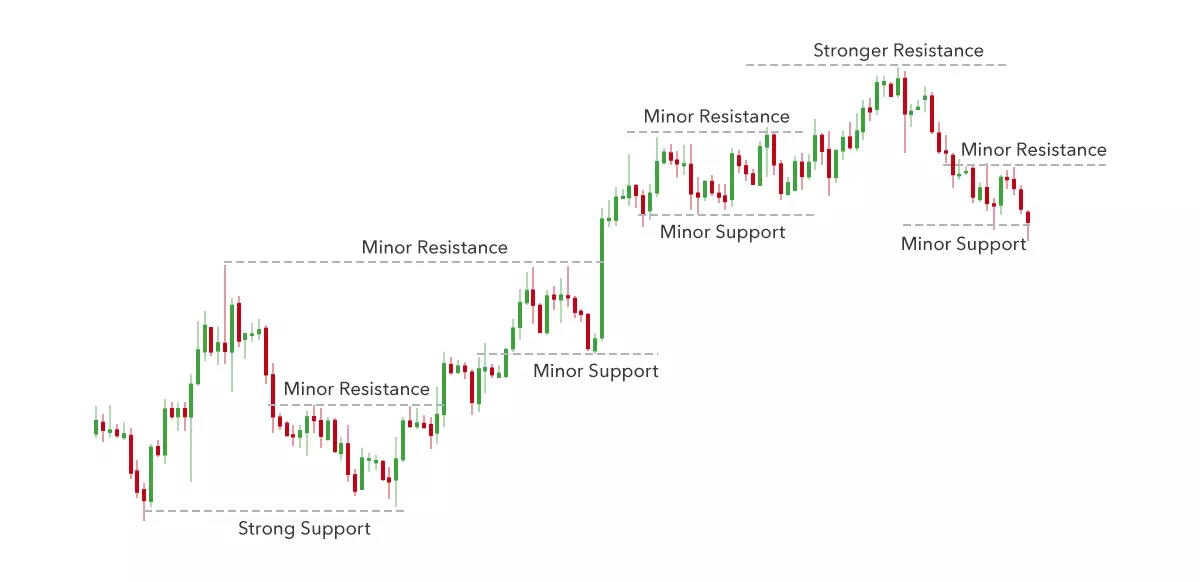
As you can see in the chart above, the market often goes past, or stops short, of each support or resistance line - no matter how strong they appear to be.
When a market touches or jumps through support or resistance briefly before reversing, it's said to be testing the level.
Lesson summary
- Support is like a glass floor and resistance is like a glass ceiling that restricts a market's movements
- They are not exact levels, but more price zones
- When a market price reaches a support or resistance level but doesn't break through, it's said to be testing the level
-
1
Introduction to technical analysis
3 min -
2
Types of charts
6 min -
3
Support and resistance
4 min -
4
Breakouts and fakeouts
4 min -
5
Trends and channels
4 min -
6
Basic chart patterns: part one
5 min -
7
Basic chart patterns: part two
6 min -
8
Candlestick patterns
7 min -
9
Moving averages
5 min -
10
Using moving averages
6 min -
11
Choosing your analysis tools
5 min -
Quiz
10 questions
@2003 - 2023