A trader's guide to moving averages
A popular technical indicator, the moving average can help you spot trends. Learn how to calculate the moving average and how you can use it in your trading.
Technical indicators can make a big difference while trading. Among the most popular strategies used to indicate emerging and common trends is calculating the moving average (MA). Put simply, the MA is the mathematical formula used to find averages, using data to find trends.
What is the moving average?
The MA is a technical indicator used by traders to spot emerging and common trends in markets. It is a mathematical formula used to find averages by using data to find trends and smooth out price action by filtering out ‘noise’ from random fluctuations.
In stock market analysis, a 50 or 200-day moving average is most commonly used to see trends in the stock market and indicate where stocks are headed. The MA is used in trading as a simple technical analysis tool that helps determine price data by customising average price. There are many advantages in using a moving average in trading that can be tailored to any time frame. Depending on what information you want to find out, there are different types of moving averages to use.
A moving average can be used to provide support in an uptrend, the average can act as a base ground or 'support'. In a downtrend, a moving average can act as resistance, or a 'ceiling'.
How to calculate moving average
The MA is the calculated average of any subset of numbers, using a technique to get an overall idea of the trends in a data set. Once you understand the MA formula, you can start to calculate any subsets to get your MA. It can be calculated for any period of time, making it extremely useful to forecast both long and short-term trends.
To calculate the MA, you simply add up the set of numbers and divide by the total number of values in the set. For example, if you wanted to calculate the moving average of a five-year period, you would add up the numbers over that period, and then divide by five.
The moving average is very similar to finding the 'middling' value of a set of numbers, the difference being that the average is calculated several times for several subsets of data.
How do traders use moving averages?
Using MAs can be fundamental for technical analysis strategies, and using a combination of techniques can result in long and short-term forecasts. MAs can be calculated manually and used in any chart analysis simply by following the formula.
As discussed above, MAs can be used to determine levels of support and resistance. IG charts feature MAs, as well as other technical tools like Bollinger bands and relative strength index (RSI), in order to help traders with technical analysis. It can be used by clicking the ‘technical’ tab at the top of the chart.
It’s also important to note that there are two main types of MAs; exponential moving averages (EMA) and simple moving averages (SMA).
Exponential moving average
The EMA is calculated by placing greater weight on the most recent data points. It can sometimes be referred to as the exponentially 'weighted' moving average. This is because EMAs react significantly to the most recent price changes.
The most popular EMAs are 12 and 26-day EMAs for short-term averages, whereas the 50 and 200-day EMAs are used as long-term trend indicators. When used in conjunction with other indicators, EMAs can help traders confirm significant market moves and gauge their legitimacy.
Simple moving average (SMA)
The SMA formula is calculated by taking the average closing price of a security over any period desired. To calculate a moving average formula, the total closing price is divided by the number of periods.
For example, if the last five closing prices are:
28.93+28.48 +28.44+28.91+28.48 = 143.24
The five-day SMA is: 142.24/5= 28.65.
SMA vs EMA
Both the SMA and the EMA are commonly used formulas. The two are very similar, but have a significant point of difference; the sensitivity each one shows to changes in data. The EMA gives a higher significance to recent prices, while the SMA gives significance to all values.
Both are used in technical analysis and can be interpreted in the same manner to even out price variations.
While some might argue it is more common to see the SMA used by technical analysts, others might say that using EMAs can be more significant to analysis because of their nature and the significance they give to recent data. EMAs tend to be timelier and therefore can be favoured by some analysts, also tending to respond to price changes faster than SMAs.
How to trade using moving averages
Using MAs while trading can help identify trends and become significant in building trading strategies. If price action is above a moving average it can be indicative of long positions, while if the price action is below the moving average, it can be an indication that short positions should be taken.
Traders can also use the moving average crossover method as a trigger into new positions. This method is one that is commonly used in trading strategies.
Day trading using moving averages
Using MAs for day trading can be extremely beneficial. It can be a clean and simple way to understand when a stock is trending and to analyse the market. Day traders would benefit from using MAs because they need to make quick decisions without having to do complicated calculations - often they’re required to make decisions within short periods of time, making the MA formulas a common go-to for day traders.
MAs can provide a simple yet effective way to know what side of the market you should be trading that day. If it’s trading below the moving average point, then this can be a clear indicator to take the short position. While using MAs can be useful, it is important to note that nothing in financial markets is for certain when using technical indicators, and things can change quickly. While MAs can be helpful and provide great analysis, they’re not a magic formula that can predict which way to trade.
If you think of MAs as a useful tool, used in conjunction with other indicators, they can provide useful information to aid in your day-to-day trading decisions.
Moving average trading strategies
The use of multiple moving averages will typically enable a more powerful trading strategy. The three examples below are examples of moving average trading strategies that utilise multiple averages.
Trend trading with multiple averages
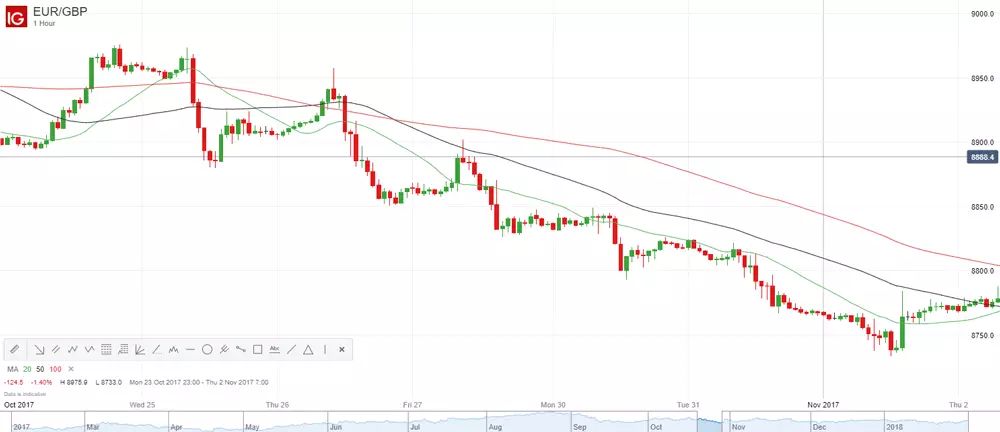
A market that is highly trending will typically show an element of order in relation to moving averages. The chart below highlights that for an upwardly trending market, we should see the price trade below the short-term SMA, with the medium and then long-term averages above that. This would be inverted for a downtrend.
Learn more about technical analysis techniques at IG Academy.
When a market displays this form of orderly characteristic, it allows for a trending market following trading strategy. Buying (uptrend) or selling (downtrend) at the nearest moving average would then allow for traders to find entry points within this highly trending market.
The EUR/GBP chart below highlights this technique, with the price turning back onto the bearish trend from the lower (20) SMA on a number of occasions. The push through the highest moving average (200) provided a signal that this trend is over.
Golden/death cross
The moving average crossover method is one of the most commonly used trading strategies, with a shorter-term SMA breaking through a longer-term SMA to form a buy or sell signal. The death cross and golden cross provide one such strategy, with the 50-day and 200-day moving averages in play. The bearish form comes when the 50-day SMA crosses below the 200-day SMA, providing a sell signal. Conversely, a bullish signal comes where the 50-day SMA breaks above the 200-day SMA.

Mean reversion using Bollinger bands
This strategy utilises the Bollinger band tool with the 20-day SMA placed within the middle of the bands. This technique can be used without the Bollinger bands, but using the bands provides some additional benefits. The idea behind this method is that even when we see a highly trending market, the price will often return to mean before pushing back in the direction of the trend. As such, the middle Bollinger band (the 20-day SMA) will often be utilised as support or resistance, providing a useful buying and selling tool.
The chart below highlights the strategy in action, with the price falling below the 20-day SMA on the top left, indicating the switch from bullish to bearish sentiment. From there on in, the reversion back into the 20-day SMA provided a host of profitable selling opportunities.
On this occasion, the upper Bollinger band would have been useful as a tool to place your stop loss above. Alternatively, utilising the prior swing high would have also provided a profitable trading strategy. The dotted horizontal lines signal where those swing highs are located.

This information has been prepared by IG, a trading name of IG Markets Limited. In addition to the disclaimer below, the material on this page does not contain a record of our trading prices, or an offer of, or solicitation for, a transaction in any financial instrument. IG accepts no responsibility for any use that may be made of these comments and for any consequences that result. No representation or warranty is given as to the accuracy or completeness of this information. Consequently any person acting on it does so entirely at their own risk. Any research provided does not have regard to the specific investment objectives, financial situation and needs of any specific person who may receive it. It has not been prepared in accordance with legal requirements designed to promote the independence of investment research and as such is considered to be a marketing communication. Although we are not specifically constrained from dealing ahead of our recommendations we do not seek to take advantage of them before they are provided to our clients. See full non-independent research disclaimer and quarterly summary.

Discover how to trade the markets
Explore the range of markets you can trade – and learn how they work – with IG Academy's free ’introducing the financial markets’ course.