The basics of technical analysis
Course overview
Description
Technical analysis can help you make sense of the way investor behaviour drives market prices. In this course we show you how to start using charts to forecast which way a market might move – helping you spot potential trading opportunities.
You’ll get to know the different types of chart available and how they work. And you’ll learn to identify some key chart patterns and understand their implications.
We’ll also introduce you to some of the most popular technical indicators – tools you can use to derive trading signals from market price data – and show you how to apply them.
Time
Level
Benefits
Lessons
-
1
Introduction to technical analysis
3 min -
2
Types of charts
6 min -
3
Support and resistance
4 min -
4
Breakouts and fakeouts
4 min -
5
Trends and channels
4 min -
6
Basic chart patterns: part one
5 min -
7
Basic chart patterns: part two
6 min -
8
Candlestick patterns
7 min -
9
Moving averages
5 min -
10
Using moving averages
6 min -
11
Choosing your analysis tools
5 min -
Quiz
10 questions
Example lesson: understanding support and resistance
In this course you’ll find exercises, charts and illustrations demonstrating how technical analysis can highlight potential opportunities to go long or short. To give you a flavour of what to expect, here’s an extract explaining the concepts of support and resistance:
The lines marked 1 and 2 below each represent a support or resistance level. Which is which?
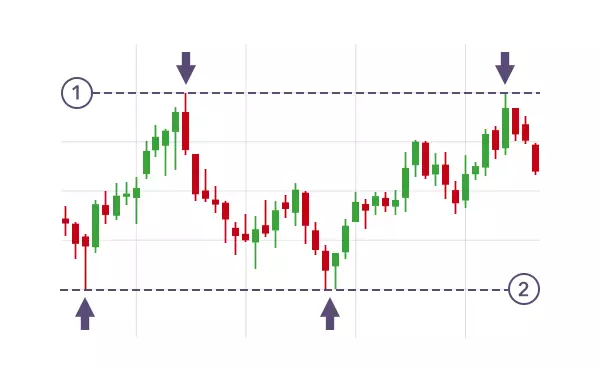
A. Line 1 is support, line 2 is resistance
B. Line 1 is resistance, line 2 is support
Answer is B.
Resistance is the ceiling that the price struggles to break through. Support is the floor where the price tends to stop declining.
Spread bets and CFDs are complex instruments and come with a high risk of losing money rapidly due to leverage. 68% of retail investor accounts lose money when trading spread bets and CFDs with this provider. You should consider whether you understand how spread bets and CFDs work, and whether you can afford to take the high risk of losing your money. Professional clients can lose more than they deposit. All trading involves risk.
The value of shares, ETFs and ETCs bought through a share dealing account, a stocks and shares ISA or a SIPP can fall as well as rise, which could mean getting back less than you originally put in. Past performance is no guarantee of future results.
CFD accounts provided by IG Markets Ltd, spread betting provided by IG Index Ltd and share dealing and stocks and shares ISA accounts provided by IG Trading and Investments Ltd. IG is a trading name of IG Markets Ltd (a company registered in England and Wales under number 04008957), IG Index Ltd (a company registered in England and Wales under number 01190902) and IG Trading and Investments Ltd (a company registered in England and Wales under number 11628764). Registered address at Cannon Bridge House, 25 Dowgate Hill, London EC4R 2YA. IG Markets Ltd (Register number 195355), IG Index Ltd (Register number 114059) and IG Trading and Investments Ltd (Register number 944492) are authorised and regulated by the Financial Conduct Authority.
The information on this site is not directed at residents of the United States, Belgium or any particular country outside the UK and is not intended for distribution to, or use by, any person in any country or jurisdiction where such distribution or use would be contrary to local law or regulation.
All trading involves risk.
© 2003-2026