Beginners' guide to fundamental analysis
Use fundamental analysis to identify markets that are under- or over-priced, by looking at the economic and financial factors which affect their value. Learn about fundamental analysis and how to use it in your trading.


What is fundamental analysis?
Fundamental analysis is a means of measuring a company’s actual or ‘intrinsic’ value by assessing economic and financial factors, such as a balance sheet, macroeconomic indicators and management forecasts.
Most companies’ share prices will not always reflect their intrinsic value, as market prices are driven by rational elements – such as a company’s ability to generate revenue and profits – as well as irrational factors, such as market sentiment towards a company and media perception.
Fundamental analysis is used to estimate the intrinsic value of a stock, ignoring short-term trends and investor enthusiasm, to determine the true price that a company should be trading at.
Once you know the intrinsic value of a stock, you can compare it to the market price. You’ll then be able to tell whether a company is undervalued or overvalued – giving you an indication of whether to buy or sell the asset.
For example, if a stock was overpriced, it could decline at some point in the future and if the stock was undervalued, you could take a position early and profit if the market value changes to reflect the intrinsic value.
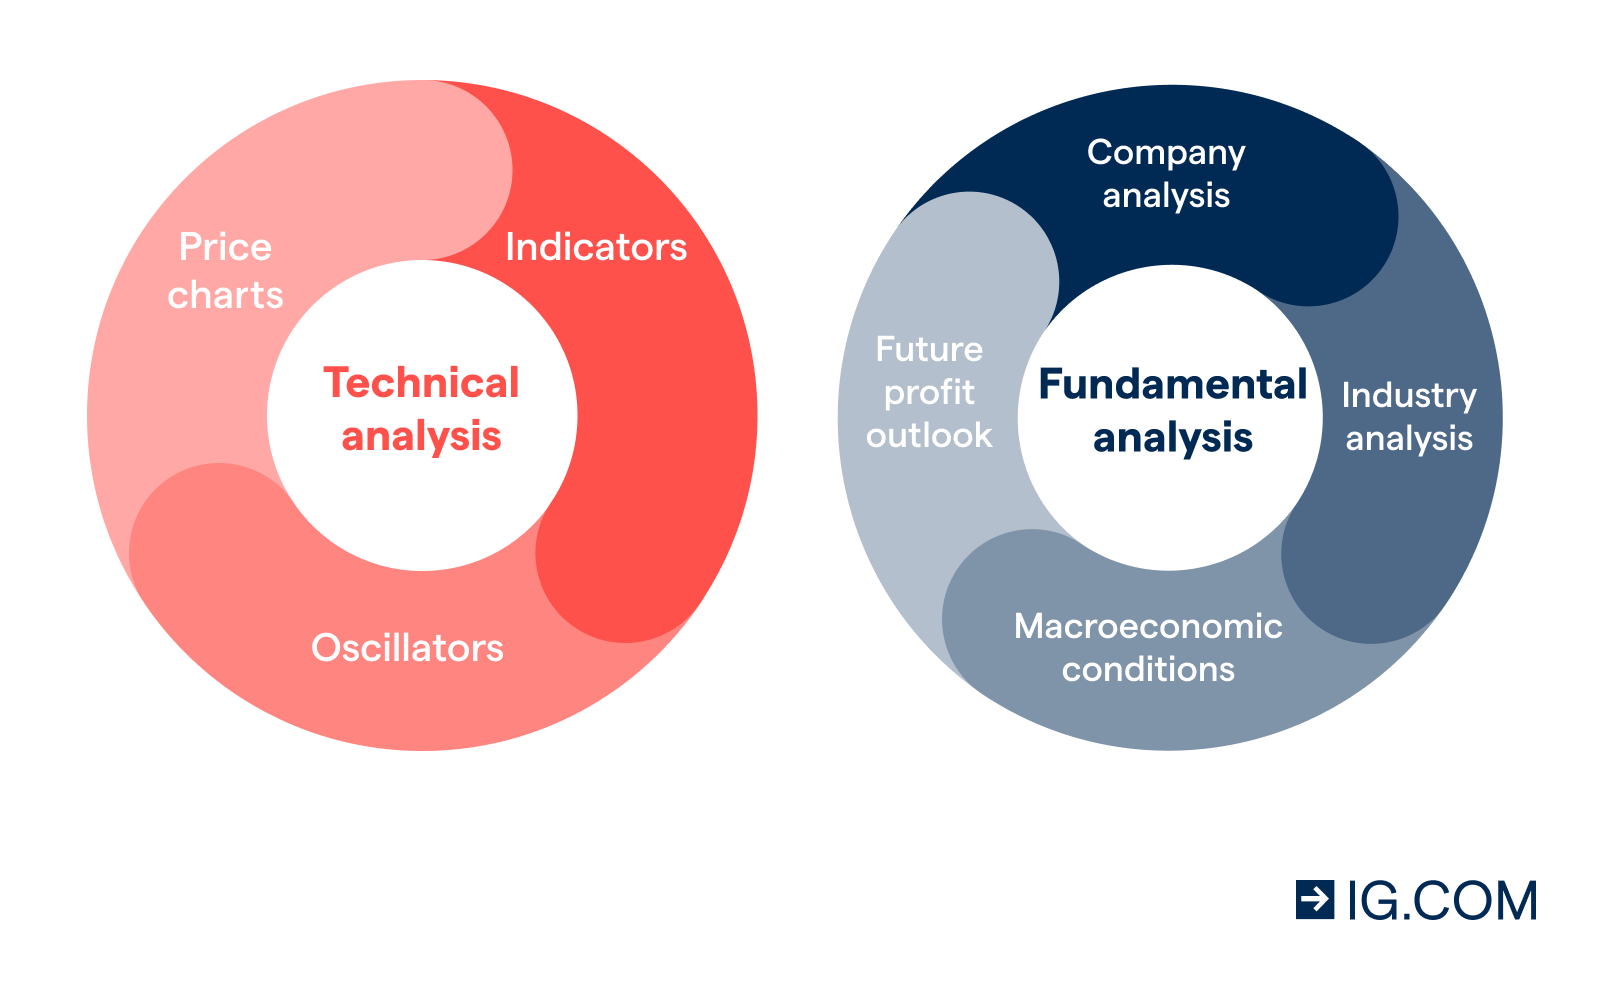
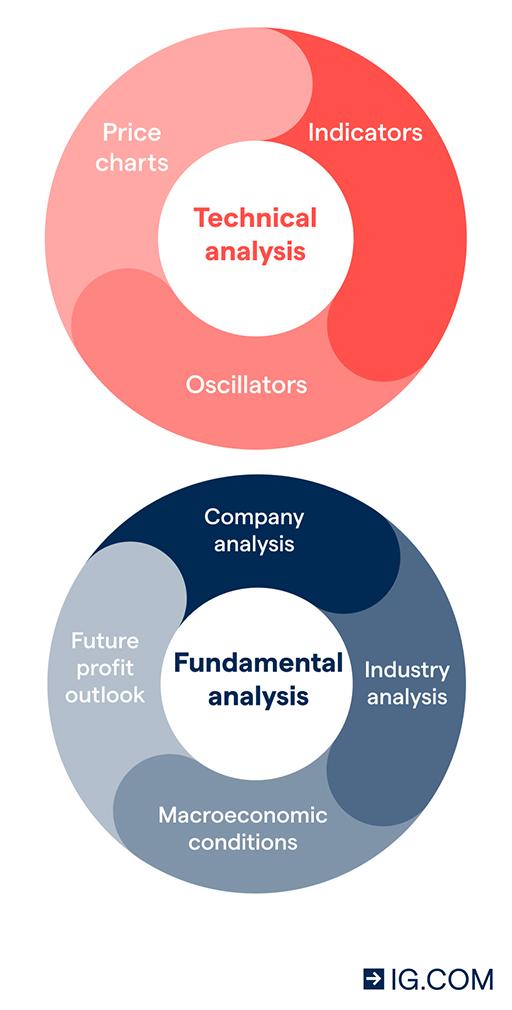
Fundamental analysis vs technical analysis
Technical analysis is concerned with the historical price movements of an asset. So, you’d need knowledge of chart patterns and what each pattern might mean for the future price movements of a stock.
Learn about 16 candlestick patterns all traders should know
Fundamental analysis, on the other hand, requires an in-depth knowledge of your chosen market and sector so that you can quickly and accurately identify viable companies based on news reports, financial statements or changes in company leadership.
Different types of fundamental analysis
Fundamental analysis’s primary goal is to estimate the intrinsic value of a company, or the value at which the price should tend to over time. This can be achieved using several methodologies, which are often divided in two categories: quantitative and qualitative analysis.
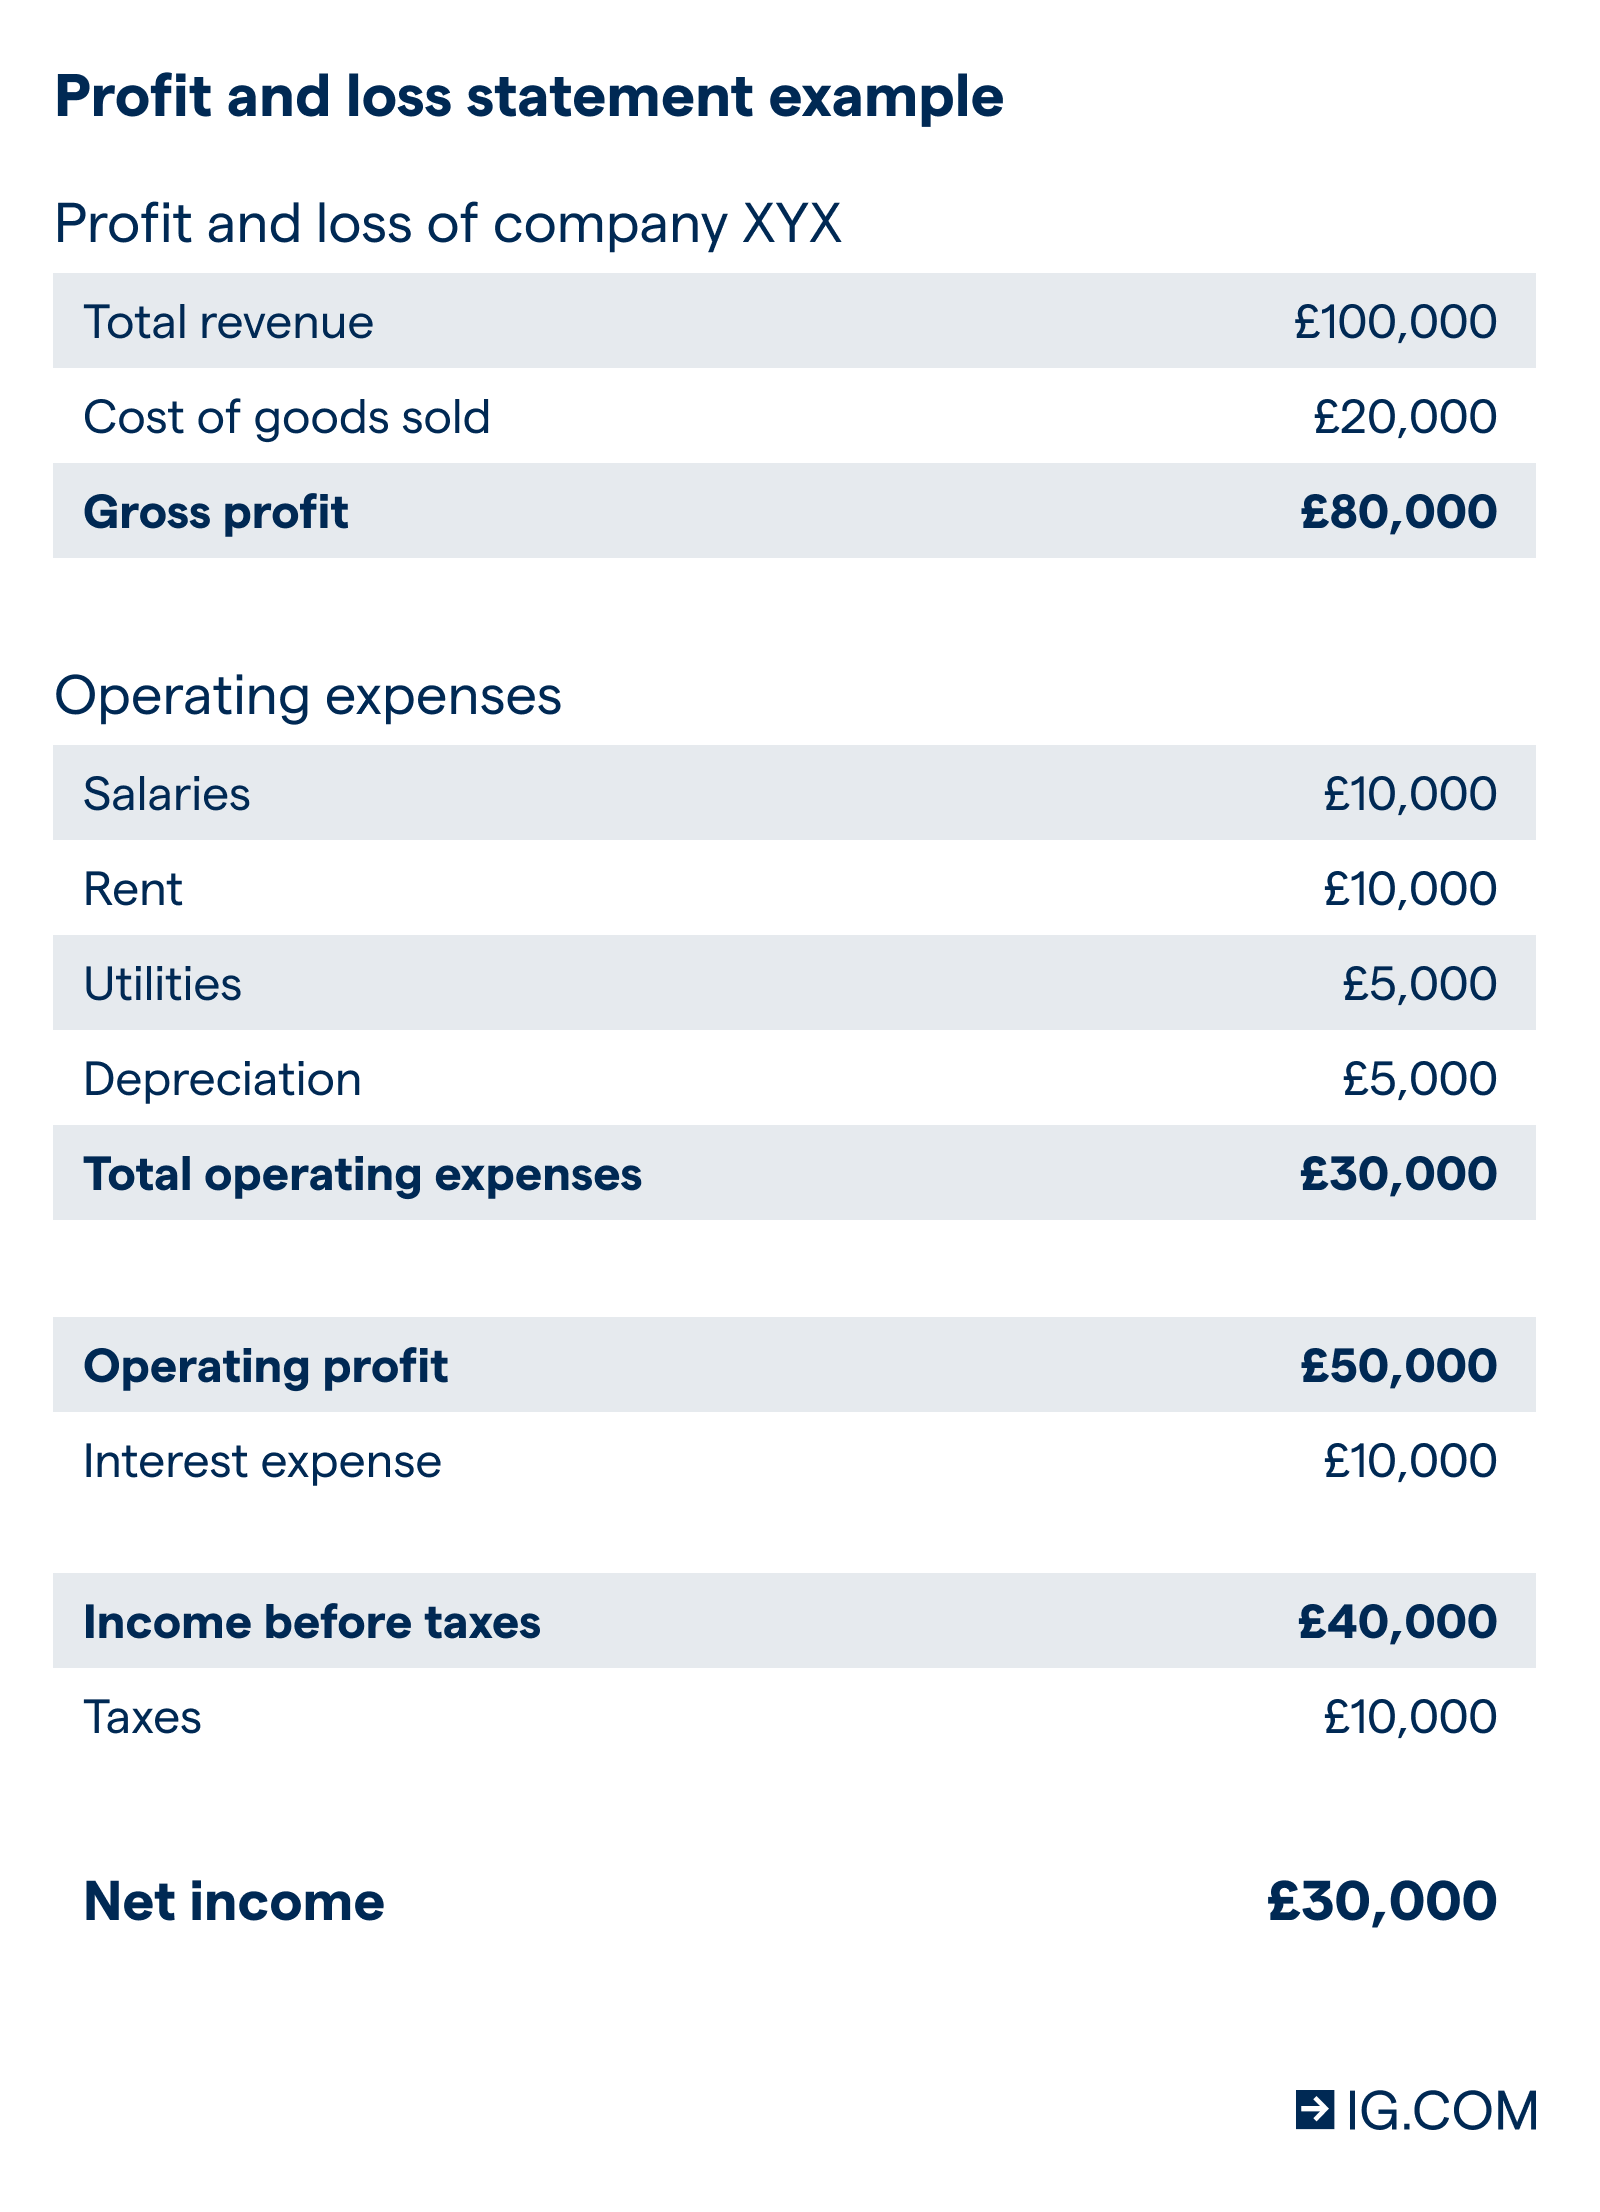
Quantitative fundamental analysis methods look at a company’s viability as an investment in numerical metrics, such as profit and loss statements, cash flow statement and market share.
A trader would use these metrics to assess how the company is being run, and whether it is capable of yielding a profit. It is with this analysis that the trader might decide to open or close a position, depending on how profitable they perceive the company to be.
Then there’s qualitative fundamental analysis which assesses factors that affect the character or quality of the company, such as brand recognition, senior management or customer satisfaction.
On the whole, fundamental analysis is focused on qualitative analysis. Popular qualitative analysis methods include:
Top-down or bottom-up approach
To use a top-down approach, you’d look at global macroeconomic metrics – including gross domestic product (GDP), unemployment rates, inflation, and interest rates – to identify favourable countries and regions.
Once the list is narrowed for the top performing countries, you’d identify stand-out industries within those economies, which will also involve analysis the number of companies, average net profit margin and price elasticity.
Finally, you’d refine the remaining list to include only the best businesses in those sectors, in terms of price-to-earnings (P/E) ratio, profit and loss and other metrics.
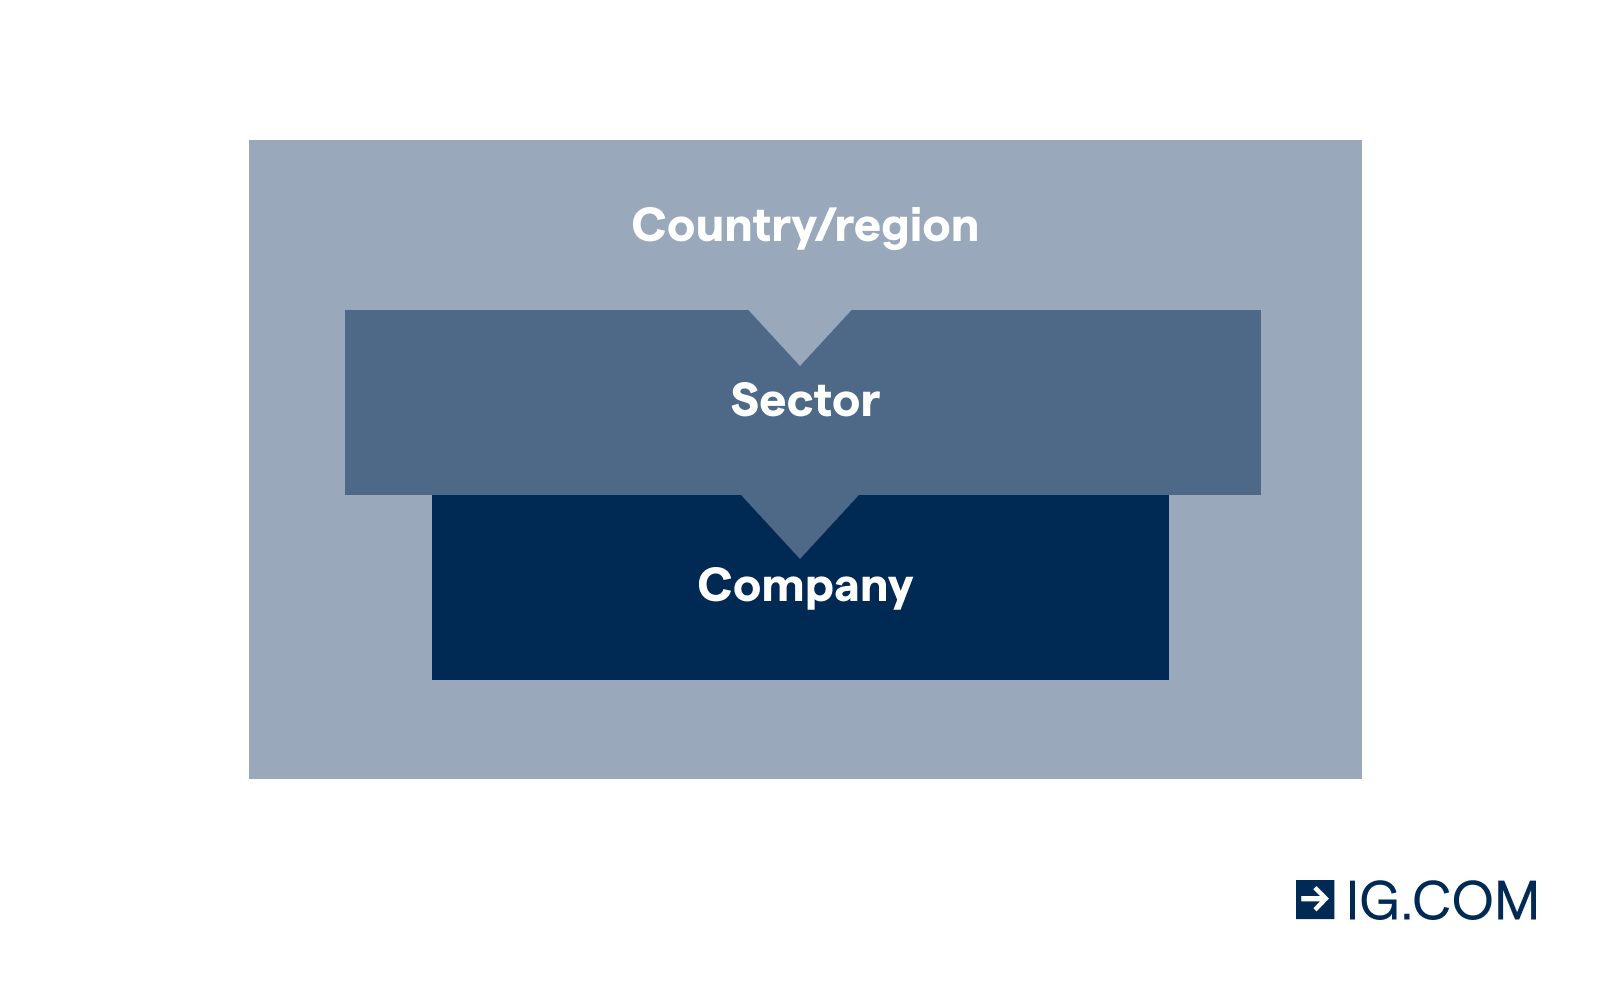
The bottom-up model follows an opposite filtering order, going from analysing individual companies and then widening your search to include relevant studies on the sector and country or region they are in.The bottom-up model follows an opposite filtering order, going from analysing individual companies and then widening your search to include relevant studies on the sector and country or region they are in.
Porter’s five forces
Michael Porter developed a framework that analyses the intensity of competition within an industry, which you can use to understand the likelihood of a company's long-term profitability. It is based on five key variables:
- Barriers to entry – the threats facing new companies, such as setting up costs
- Threat of substitution – how likely it is that a consumer could switch products easily
- Bargaining power of suppliers – the number of supplies available decreases the power of each supplier to make demands
- Bargaining power of customers – the high cost of switching supplier and low competition decreases the power of consumers who have few alternatives
- Competitive rivalry – intense rivalries can drive brand loyalty and encourage strategic concentration
SWOT analysis
SWOT analysis is a method that’s focused on identifying a company’s strengths, weaknesses, opportunities and any threats.
Strengths and weaknesses are internal attributes of the organisation – such as talent or brand reputation – while opportunities and threats are based on the external environment, for example a country’s legislation or how fast the industry is growing.
This type of analysis is designed to facilitate a purely fact-driven assessment of an organisation, avoiding any emotional and inaccurate decision making. It can help guide you toward businesses that are more likely to have long-term success in their industry.
Economic moats
The term economic moats was first coined by Warren Buffett, as a way of describing a business´ ability to maintain a competitive advantage over its opponents over time. The metaphor of a medieval castle is used to solidify the idea of protecting a firm’s profits from outsiders.
Investors should look for businesses that currently have, and will be able to maintain, a competitive advantage. This allows the company to outperform the market over the long term, and hopefully secure you a profit.
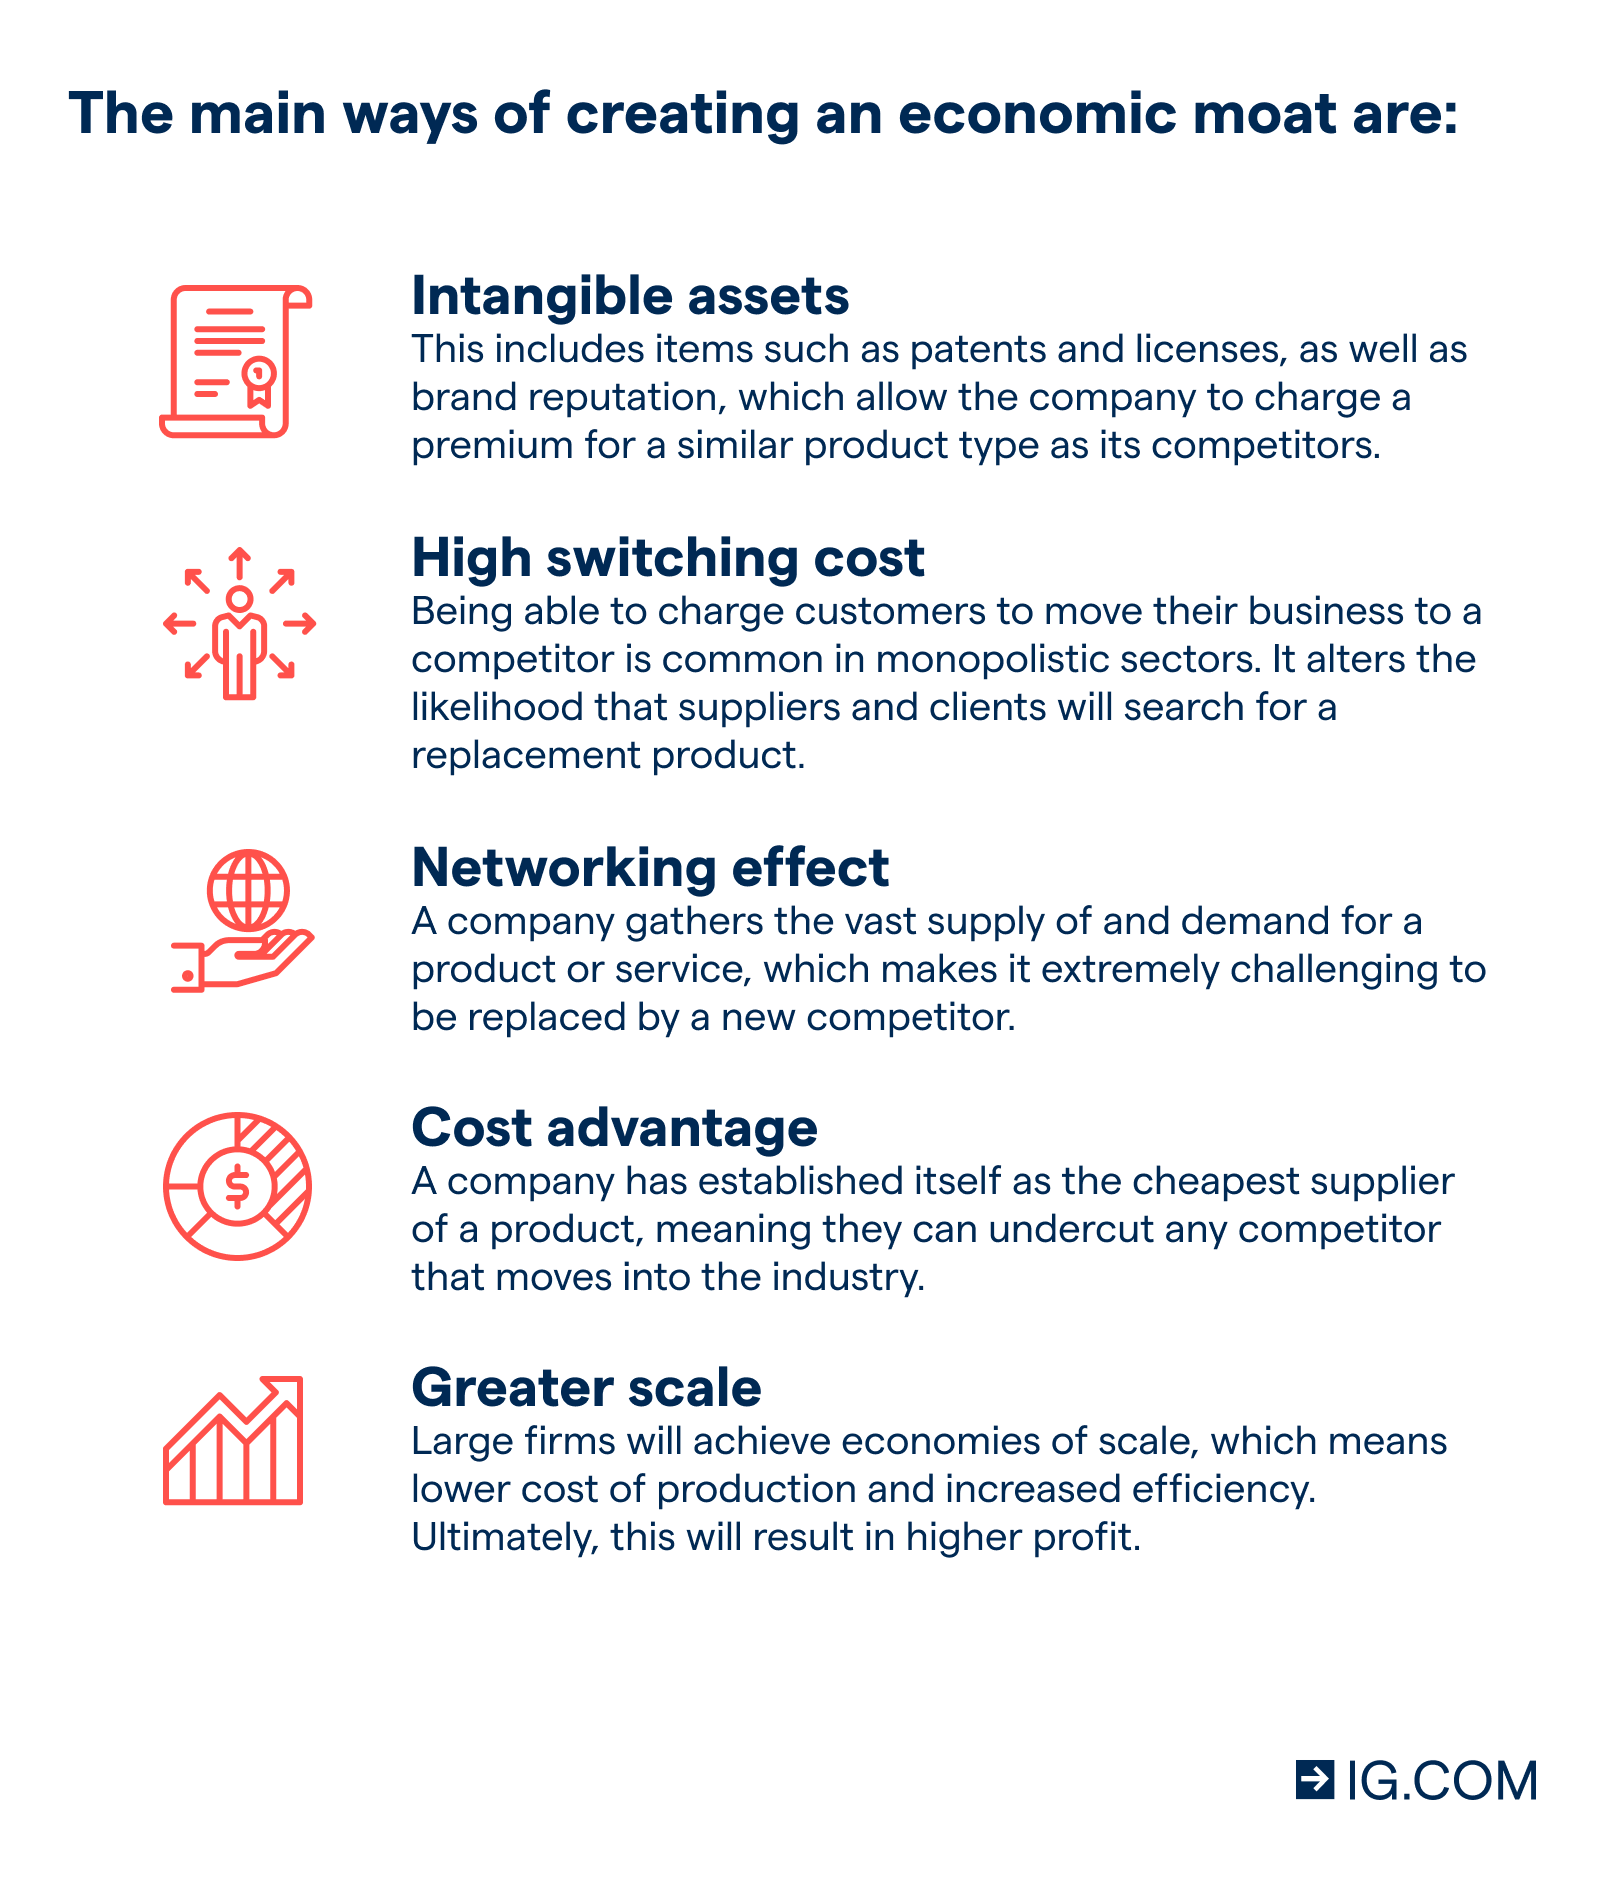
The main ways of creating an economic moat are:
How to use fundamental analysis
You can use fundamental analysis to identify buy and sell signals in the market of your choice. If your fundament analysis indicates the asset is undervalued compared to its intrinsic value, you could opt to buy the market – and if it was overvalued, you might see it as an opportunity to go short.
The way you use fundamental analysis will depend on your style of investing and your trading goals.
Value investing
Value investing seeks to identify potentially undervalued companies. Key metrics that are used include a low price-to-book or P/E ratio, economic moats and a high dividend yield. Value investors look to buy comparatively cheap companies with secure long-term prospects.
Benjamin Graham is considered by many as the father of the value investing and wrote the iconic book ‘The Intelligent Investor’. He believed that in their search for undervalued companies, a value investor will prioritise the quality of the business over the market price. As summarised by Graham’s famous student, Warren Buffett, ‘It's far better to buy a wonderful company at a fair price, than to buy a fair company at a wonderful price’.
This investment style is generally intertwined with contrarian investing, as they both argue that going against the crowd or prevailing sentiment at the time (buy when everyone is selling, sell when everyone is buying) tends to offer positive rewards.
Growth investing
Growth investing was developed by Thomas Price and popularised by Philip Fisher with his book ‘Common Stocks and Uncommon profits’. It focuses on companies with a high growth potential even if share price appears expensive in terms of metrics.
Instead of investing in an already established company, the investor will take a risk on companies that have the potential to continue growing at a higher-than-average rate. Growth companies are found predominantly in the technology or pharma sectors.
GARP investing
A growth at a reasonable price (GARP) strategy blends aspects of both value and growth investing, with investors seeking companies with exponential growth but at a competitive price.
Popularised by investment manager Peter Lynch, and developed with his book ‘One Up on Wall Street’, it uses a financial ratio called price-to-earnings growth (PEG) as its main way to identify attractive companies. Once a company is analysed, it is divided into one of six different categories based on growth potential: slow, stalwart, fast, cyclicals, turnarounds and asset plays. A concrete metric is given to each, helping to identify growth shares that are trading at a reasonable price.
Lynch also uses subjective criteria such as the customer’s satisfaction. As an example, he claims that his best investment in Taco Bell was driven by the fact that ‘he like their sandwiches’.
Pros and cons of fundamental analysis
Pros of fundamental analysis
Fundamental analysis helps traders and investors to gather the right information to make rational decisions about what position to take. By basing these decisions on financial data, there is limited room for personal biases.
Rather than establishing entry and exit points, fundamental analysis seeks to understand the value of an asset, so that traders can take a much longer-term view of the market. Once the trader has determined a numerical value for the asset, they can compare it to the current market price to assess whether the asset is over- or under-valued. The aim is to then profit from the market correction.
Cons of fundamental analysis
Fundamental analysis can be time consuming, it requires multiple areas of analysis, which can make the process extremely complicated.
As fundamental analysis takes a much longer-term view of the market, the results of the findings are not suitable for quick decisions. Traders looking to create a methodology for entering and exiting trades in the short term might be better suited to technical analysis.
It is also important to consider the best and the worst-case scenario. While fundamental analysis provides a more well-rounded view of the market, it is possible for negative economic, political or legislative changes to surprise markets.
This information has been prepared by IG, a trading name of IG Markets Limited. In addition to the disclaimer below, the material on this page does not contain a record of our trading prices, or an offer of, or solicitation for, a transaction in any financial instrument. IG accepts no responsibility for any use that may be made of these comments and for any consequences that result. No representation or warranty is given as to the accuracy or completeness of this information. Consequently any person acting on it does so entirely at their own risk. Any research provided does not have regard to the specific investment objectives, financial situation and needs of any specific person who may receive it. It has not been prepared in accordance with legal requirements designed to promote the independence of investment research and as such is considered to be a marketing communication. Although we are not specifically constrained from dealing ahead of our recommendations we do not seek to take advantage of them before they are provided to our clients. See full non-independent research disclaimer and quarterly summary.

Discover how to trade the markets
Explore the range of markets you can trade – and learn how they work – with IG Academy's free ’introducing the financial markets’ course.