AUD/USD drops post RBA meeting but EUR/JPY and USD/JPY rise as BoJ hikes
AUD/USD drops as RBA keeps rates on hold but EUR/JPY and USD/JPY rise as BoJ hikes for the first time in seventeen years.


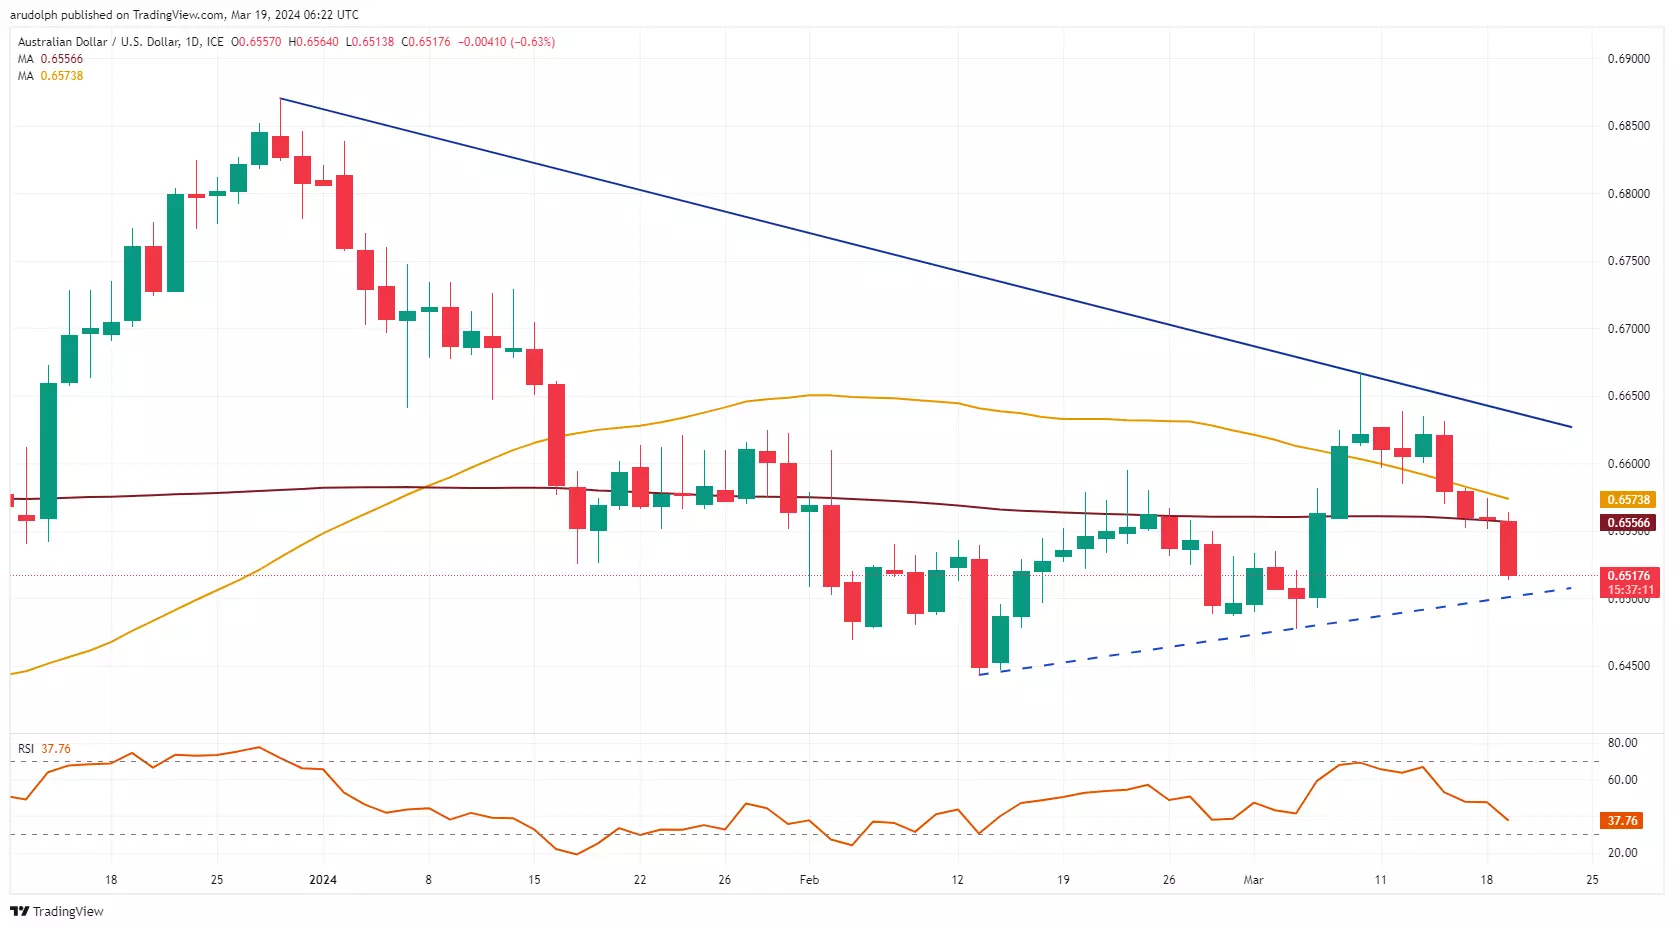
AUD/USD drops like a stone
AUD/USD's move lower from its March high at $0.6667 has taken through the 200-day simple moving average (SMA) at $0.6557, now resistance, towards the February-to-March uptrend line at $0.6502 as the Reserve Bank of Australia (RBA) kept its rates on hold but retained a dovish tone.
Further down sits the $0.6478 early March low.
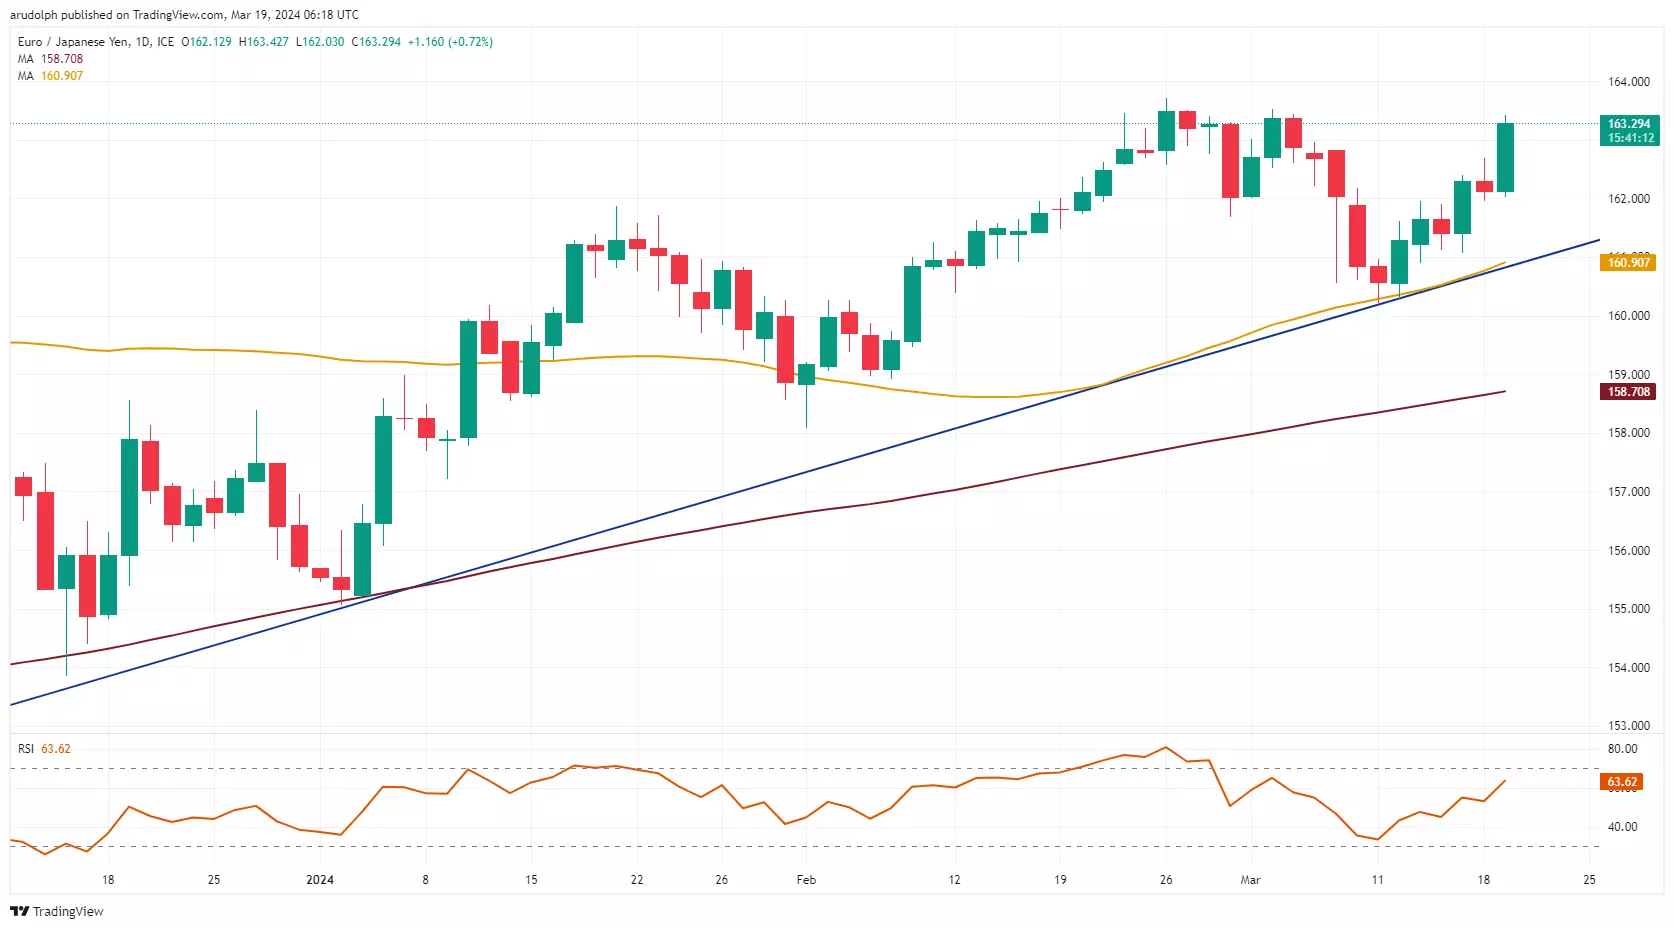
EUR/JPY nears key resistance
EUR/JPY's ascent from its ¥160.22 mid-March low is heading towards key resistance at ¥163.71-72 as the Bank of Japan (BoJ) scrapped its yield curve control and raised its rates for the first time in seventeen years. Above ¥163.71-72 lies the ¥164.31 mid-November peak.
Minor support now sits at Monday's ¥162.68 high.
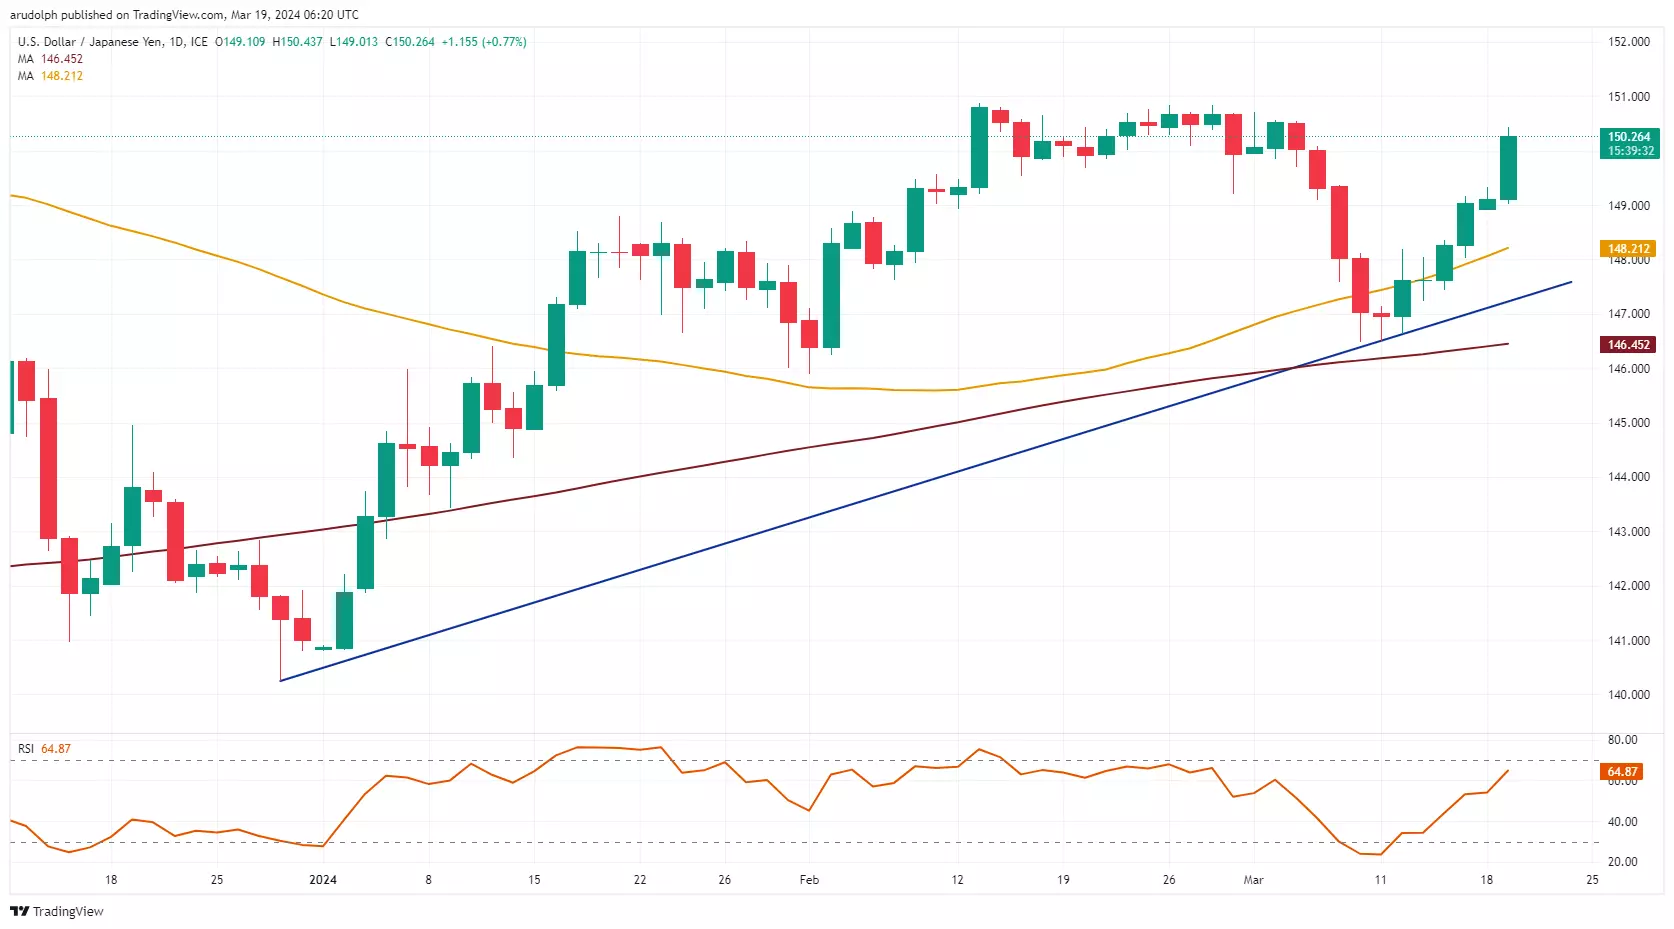
USD/JPY on track for sixth straight day of gains
USD/JPY's swift advance is taking it back towards its ¥150.83 to ¥150.88 February highs and key resistance zone despite the BoJ hiking its rates for the first time in 17 years from -0.1% to 0-0.1%.
The central bank also discontinued ETF and J-REIT purchases, is to reduce corporate bond purchases and discontinue these in about a year, removed its yield curve control program but continues purchasing government bonds. Above ¥150.88 lurks the ¥151.73 October peak. Minor support sits at the ¥149.54 mid-February low.
This information has been prepared by IG, a trading name of IG Markets Limited. In addition to the disclaimer below, the material on this page does not contain a record of our trading prices, or an offer of, or solicitation for, a transaction in any financial instrument. IG accepts no responsibility for any use that may be made of these comments and for any consequences that result. No representation or warranty is given as to the accuracy or completeness of this information. Consequently any person acting on it does so entirely at their own risk. Any research provided does not have regard to the specific investment objectives, financial situation and needs of any specific person who may receive it. It has not been prepared in accordance with legal requirements designed to promote the independence of investment research and as such is considered to be a marketing communication. Although we are not specifically constrained from dealing ahead of our recommendations we do not seek to take advantage of them before they are provided to our clients. See full non-independent research disclaimer and quarterly summary.

Start trading forex today
Find opportunity on the world’s most-traded – and most-volatile – financial market.
- Trade spreads from just 0.6 points on EUR/USD
- Analyse with clear, fast charts
- Speculate wherever you are with our intuitive mobile apps
See an FX opportunity?
Try a risk-free trade in your demo account, and see whether you’re onto something.
- Log in to your demo
- Take your position
- See whether your hunch pays off
See an FX opportunity?
Don’t miss your chance – upgrade to a live account to take advantage.
- Get spreads from just 0.6 points on popular pairs
- Analyse and deal seamlessly on fast, intuitive charts
- See and react to breaking news in-platform
See an FX opportunity?
Don’t miss your chance. Log in to take your position.
Live prices on most popular markets
- Equities
- Indices
- Forex
- Commodities
Prices above are subject to our website terms and agreements. Prices are indicative only. All share prices are delayed by at least 15 minutes.
Prices above are subject to our website terms and agreements. Prices are indicative only. All shares prices are delayed by at least 15 mins.