Stock market rallies: what you need to know
Discover everything you need to know about stock market rallies – including the difference between bull and bear rallies, their causes and how you can identify them.


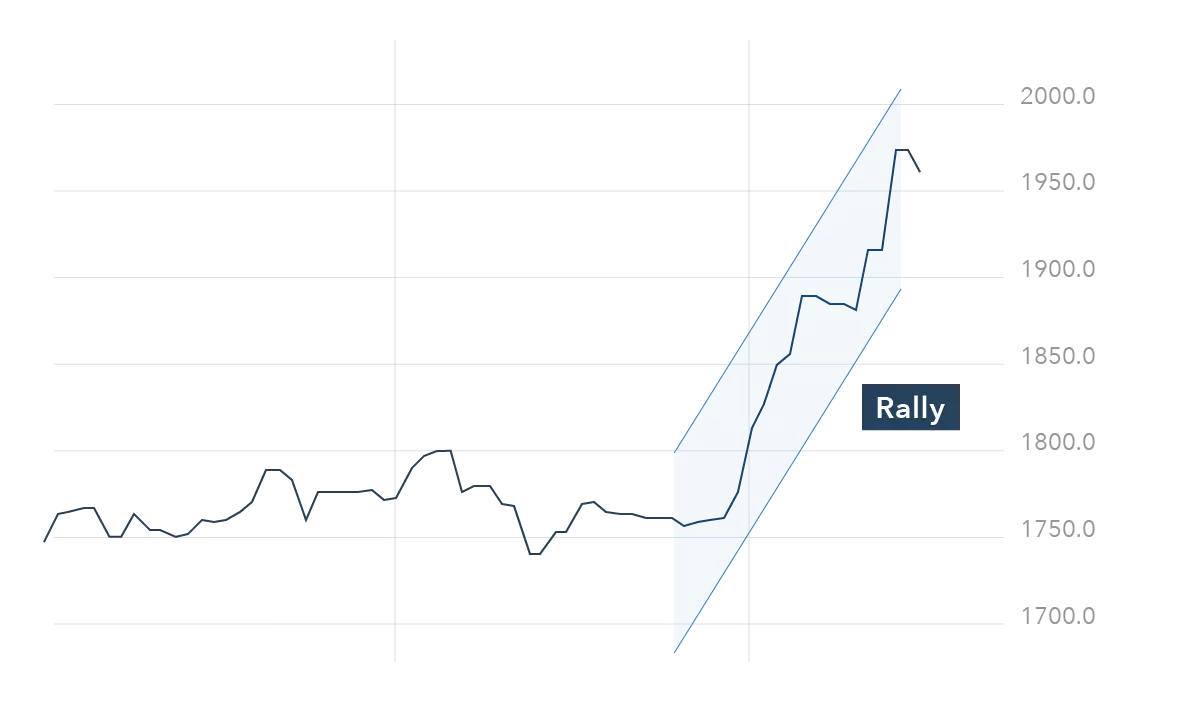
What is a stock market rally?
A stock market rally is a sustained rise in stock and index prices – usually a 10% to 20% increase. The movement is simply a result of a large surge in the demand for an asset, which can occur in most market conditions – including flat or declining markets.
Stock market rallies are commonly associated with bull markets, but can occur in bear markets too. But to be considered a bear market still, the rally cannot rise above the price level at which the initial decline started.
Your interest in a rally could vary depending on the style of trading you prefer. For example, if you’re a scalper – who prefers to hold a position from seconds to minutes – you might only focus on a much shorter period of the rally. Whereas if you’re a position trader, who focuses on much longer-term movements, you might aim to trade the upward movement for weeks or months.
What is a bull market rally?
A bull market rally is considered the default type of market rally. It occurs when prices are rising and there is optimism this trend will continue for a long time.
The duration or strength of a rally will vary depending on how many sellers enter the market and how quickly they take back control. Understanding the different types of bull market is vital if you want to identify how long each rally will last. There are a lot of terms used to describe bull markets, but these are the most common:
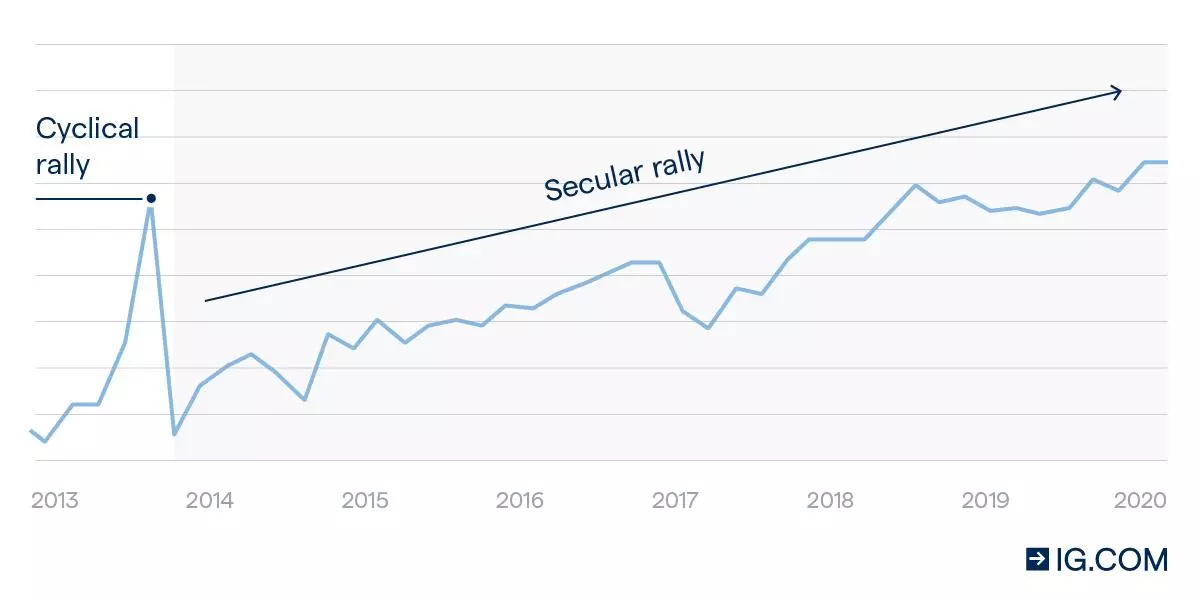
- Secular. This type of bull market will last for a long period of time – anything from five to 25 years. While market corrections – declines of 10% – can occur, a secular market wouldn’t enter a complete bear market. Usually, secular markets are only identified after the fact
- Cyclical. These bull markets are much shorter, and are sentiment driven. They can cover anything from a month to a couple of years. Cyclical markets are characterised by peaks and troughs in line with the state of the economy – this volatility means that rallies are likely to be brief
- Intraday. An intraday bull market or rally only lasts within a single trading day. They can happen during falling markets or cause a market to reach higher highs. While investors may not focus on such short-term movements, these smaller price increases are a trader’s bread and butter
While bull markets can last for different durations, it’s important to remember that prices can change direction at any time. Creating a risk management strategy is key to minimising the risk of reversals – this should include adding stop-losses to close positions after a certain amount of loss, or limit-close orders to lock in profit.
Learn more about risk management
What causes a bull market rally?
Bull market rallies can occur for a number of different reasons, such as a strong economy, high consumer spending, increasing stock valuations and higher-than-expected earnings releases.
As positive news floods the market, increased investment can cause prices to rise, leading to more buyers entering the market and pushing prices even higher.
Bull market rallies can be known to be purely speculative – with traders recognising an upward trend early on and buying into it, regardless of whether prices are pushed beyond the stock’s true value. When prices are based on exorbitant bidding rather than fundamentals, the rally is known as a speculative bubble. An example would be the dot-com bubble of the late 90s.
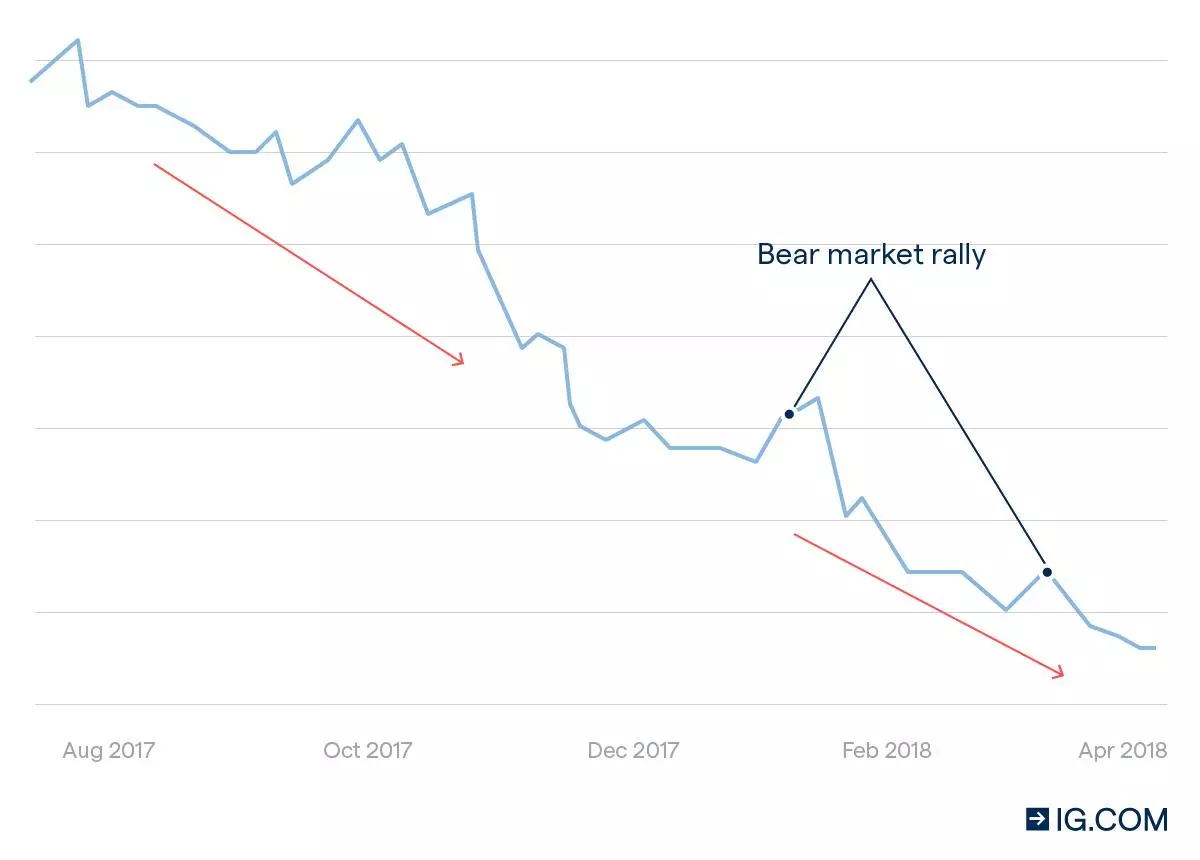
What is a bear market rally?
A bear market rally is an upward market movement in an otherwise strong downtrend. Although there is no specific definition, an increase of 5% or more can be considered a bear market rally. However, the movement is just a temporary bounce in prices before the larger downtrend continues.
To understand why bear market rallies happen, it’s important to know what a bear market is. Typically, they’re defined as a sustained decline of 20% or more in stock prices. Bear markets will have different durations depending on the strength of the movement but they can be accompanied by a recession or economic slowdown. This means bear markets can take years to recover from.
It’s normal for rallies to occur during market declines, and unless the price rises by more than 20% again, it is still considered a bear market. Bear market rallies are an essential part of the market cycle, as they do indicate changes in investor sentiment. However, these rallies rarely last longer than days or weeks until a market correction occurs.
Want to trade a bear market rally? Create an account to get started.
What causes a bear market rally?
Bear market rallies are normally caused by ‘bottom fishing’, which is the term used to describe investors who eagerly watch a downturn, waiting for signs of an impending bull market.
This is why bear market rallies are considered particularly risky because the false signals can cause investors to rush in to positions out of a belief that they can recover some of the losses they have incurred in the slowdown. But, as the market returns to its downward momentum, these bullish investors will just add to their growing losses. This is why bear market rallies are also known as bull traps or a dead cat bounce.
Bear market rallies are a simply a type of continuation pattern. They are a pause in a wider trend that will eventually take control again. The market downturn will normally continue once enough capital has re-entered the market, causing overbought signals to introduce a second wave of selling pressure.
The confusion bear market rallies can cause is dangerous – especially for new traders or investors – and can lead to herding mentality. This is when people follow hear-say and news rather than their own analysis.
What should you do during a market rally?
Generally speaking, your reaction to a market rally will depend on the type of market rally that’s occurring. During a bull market rally, you might decide to open more long positions and take on more risk. While a bear market rally might encourage you to exercise caution, or consider short selling.
Fundamentally though, your reaction will also vary depending on whether you’re a long-term investor or short-term trader. As a longer-term investor, you might decide to avoid bear market rallies altogether, or you might decide to diversify your portfolio with higher-risk positions.
Learn more about investing with us
If you’re a trader, then identifying a bear market rally can be a great opportunity as derivatives – such as spread bets and CFDs – enable you to speculate on both rising and falling prices. So, provided you have a sound strategy for entering and exiting the market, as well as a risk management plan, you could take advantage of the both bullish and bearish market movements.
Ready to trade a market rally? Open an account today.
How can you identify a bear market rally vs a bull market?
There are a few key differences between bear and bull markets that can help you to identify the current trend and where it could head next. For example:
- Momentum. Typically, a rally losing momentum can be identified by a series of continually lower closing prices – known as lower lows. While a rally gaining momentum characteristically has increasingly higher closing prices – or higher highs. Other than the momentum indicator, other popular tools include the relative strength index (RSI), moving averages and the stochastic oscillator
- Volume. Fewer market participants engaging with a trend is an indication that the market movement is weak, while a high buying volume can indicate a strong trend. Volume indicators follow the number of executed trades and price changes to identify momentum. Examples include the money flow index (MFI) and on-balance volume
- Volatility. Although volatility indicators – such as the VIX – don’t convey the direction of movement, keeping an eye on the speed of price movements can be an indication of market sentiment
- News. It’s not sensible to use the current news as your only analysis tool, but the amount of positive news can be an indicator of what’s about to come. If there is increasingly less good news, it could indicate a market reversal
To get started trading or investing in stock market rallies, you can open an account with us. You’ll be able to choose between speculating with spread bets and CFDs, or investing via our share dealing service.
Alternatively, if you don’t feel ready to trade live markets yet, you can open a demo account to practise your strategy first in a risk-free environment.
This information has been prepared by IG, a trading name of IG Markets Limited. In addition to the disclaimer below, the material on this page does not contain a record of our trading prices, or an offer of, or solicitation for, a transaction in any financial instrument. IG accepts no responsibility for any use that may be made of these comments and for any consequences that result. No representation or warranty is given as to the accuracy or completeness of this information. Consequently any person acting on it does so entirely at their own risk. Any research provided does not have regard to the specific investment objectives, financial situation and needs of any specific person who may receive it. It has not been prepared in accordance with legal requirements designed to promote the independence of investment research and as such is considered to be a marketing communication. Although we are not specifically constrained from dealing ahead of our recommendations we do not seek to take advantage of them before they are provided to our clients. See full non-independent research disclaimer and quarterly summary.

Discover how to trade the markets
Explore the range of markets you can trade – and learn how they work – with IG Academy's free ’introducing the financial markets’ course.