EUR/JPY resumes its ascent, EUR/GBP stalls and GBP/USD bounces off support
EUR/JPY resumes its ascent on verbal BOJ intervention, while EUR/GBP stalls and GBP/USD bounces off support.


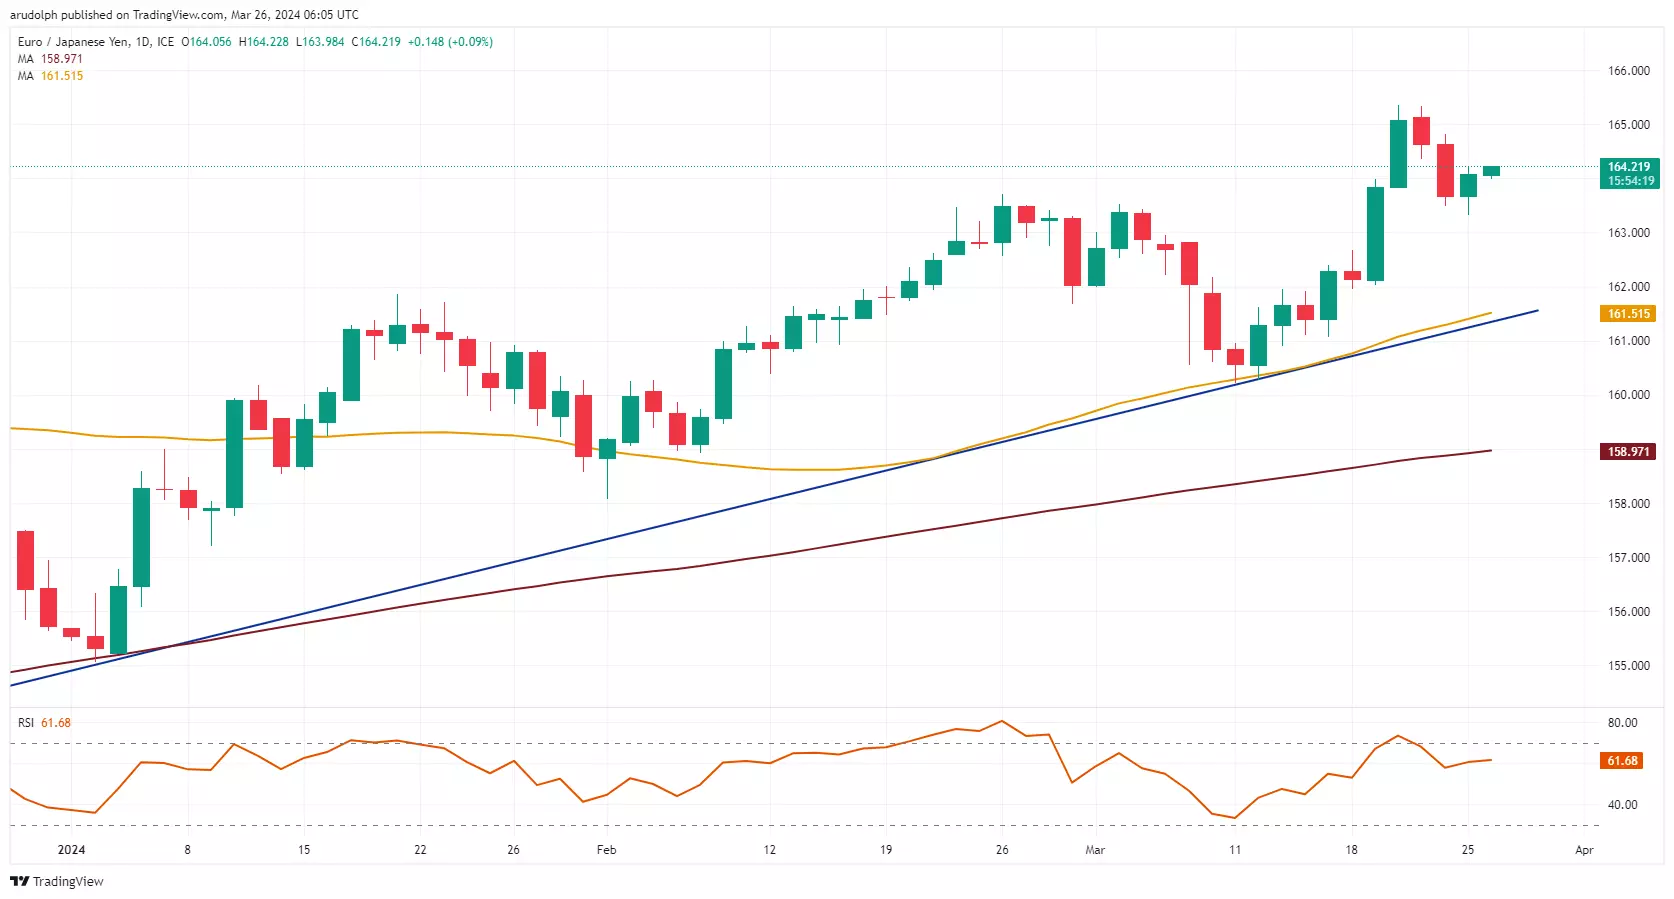
EUR/JPY resumes its ascent
EUR/JPY has recovered from Monday's ¥163.32 low and is seen heading back up towards its ¥165.35 March high, a level last traded in August 2008 with the October 2007 record high at ¥167.74 representing the next upside target.
Below Monday's ¥163.32 low lies minor support at the ¥162.68 mid-March high.
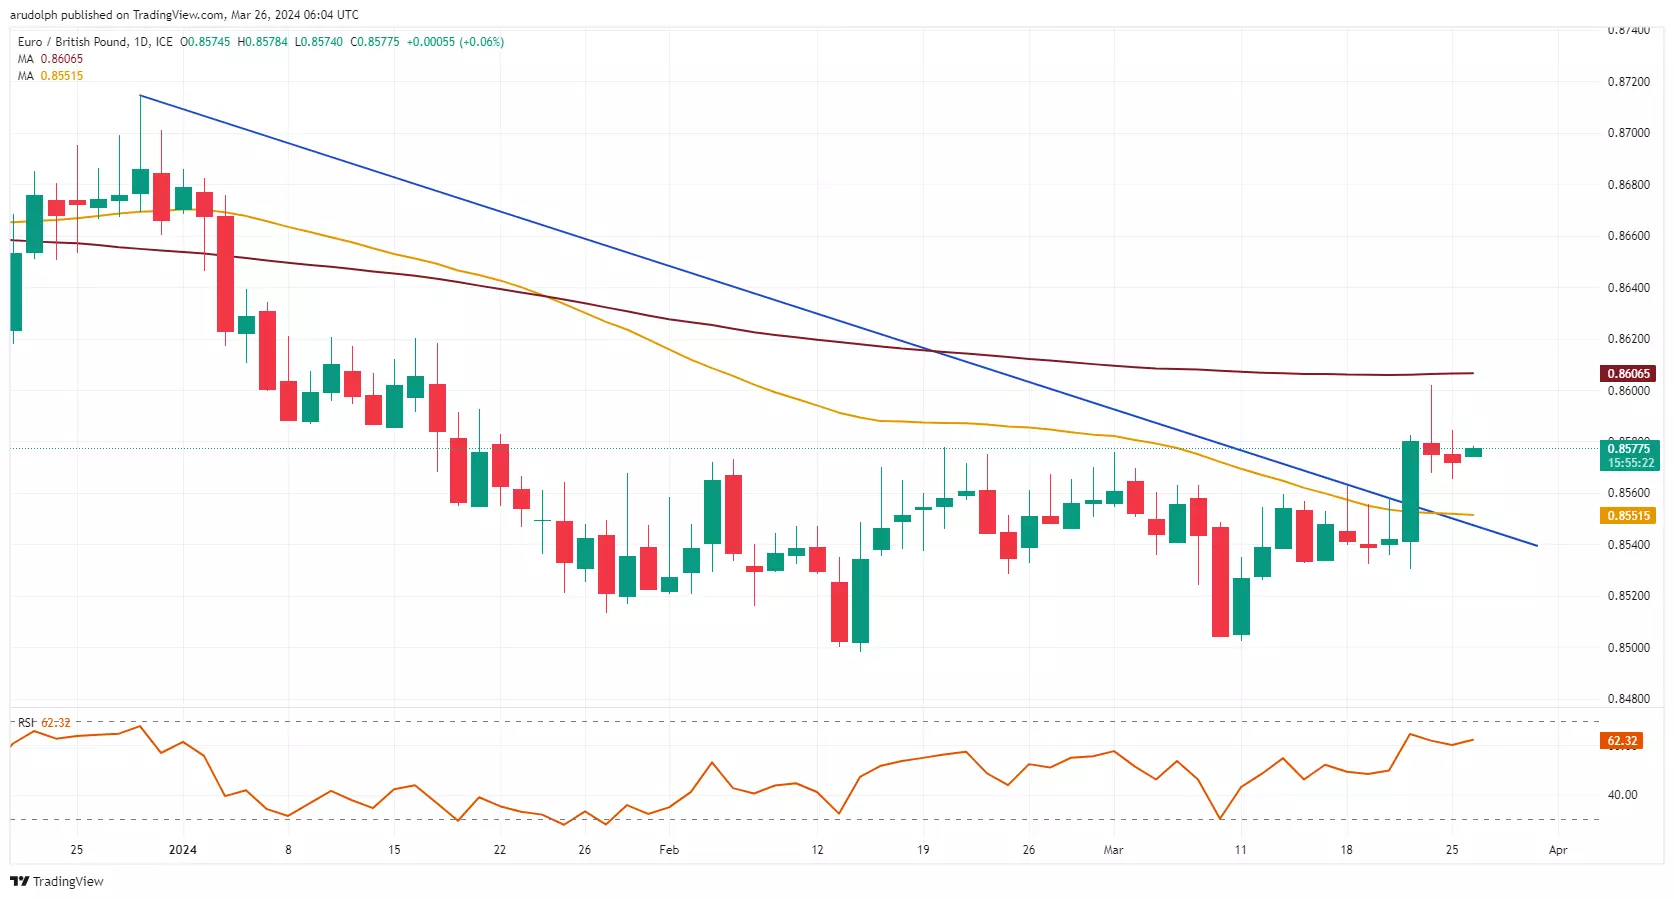
EUR/GBP consolidates
Last week's break through and daily chart close above the £0.8573 to £0.8578 key resistance area is bullish for EUR/GBP with the 200-day simple moving average (SMA) at £0.8606 remaining in focus.
Slips below this previous resistance area, now because of inverse polarity a support zone, and Monday's £0.8565 low should find support between the 18 March high and the 55-day SMA at £0.8562 to £0.8551.
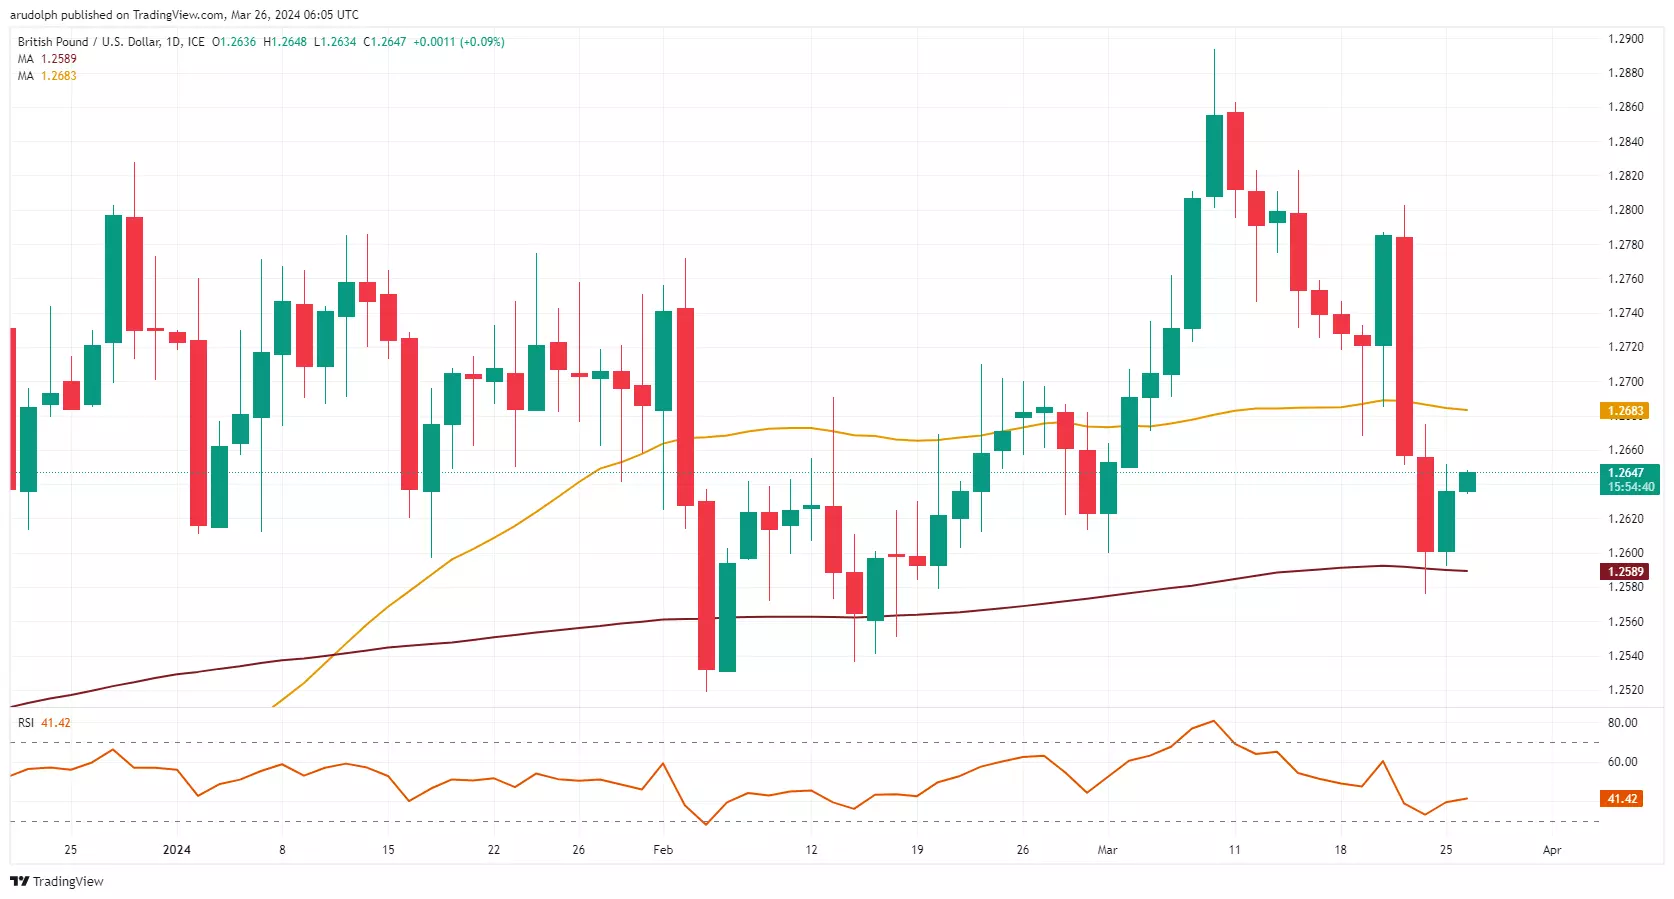
GBP/USD bounces off support
GBP/USD is seen bouncing off the 200-day SMA at $1.2589 and last week's low at $1.2576. Below this level sits key support between the December-to-February lows at $1.2519 to $1.25 which remains in sight.
Resistance is seen along the 55-day SMA at $1.2683.
This information has been prepared by IG, a trading name of IG Markets Limited. In addition to the disclaimer below, the material on this page does not contain a record of our trading prices, or an offer of, or solicitation for, a transaction in any financial instrument. IG accepts no responsibility for any use that may be made of these comments and for any consequences that result. No representation or warranty is given as to the accuracy or completeness of this information. Consequently any person acting on it does so entirely at their own risk. Any research provided does not have regard to the specific investment objectives, financial situation and needs of any specific person who may receive it. It has not been prepared in accordance with legal requirements designed to promote the independence of investment research and as such is considered to be a marketing communication. Although we are not specifically constrained from dealing ahead of our recommendations we do not seek to take advantage of them before they are provided to our clients.

Start trading forex today
Trade the largest and most volatile financial market in the world.
- Spreads start at just 0.6 points on EUR/USD
- Analyse market movements with our essential selection of charts
- Speculate from a range of platforms, including on mobile
Live prices on most popular markets
- Forex
- Shares
- Indices
