US dollar strength is here to stay: USD/JPY targets ¥160.16, EUR/USD $1.0449, GBP/USD $1.2200 region
Fundamental and technical reasons point to further US dollar strength


The US dollar trades in five-month highs and has further upside in store
A robust US labour market, sticky inflation, pushed back US rate cut expectations, and escalating tensions in the Middle East have led to a 3.5% rally in the US Dollar Basket over the past six weeks.
According to technical analysis, further greenback appreciation is also on the cards with the October-to-November highs at 106.98 to 107.05 being eyed.
US Dollar Basket Daily Candlestick Chart
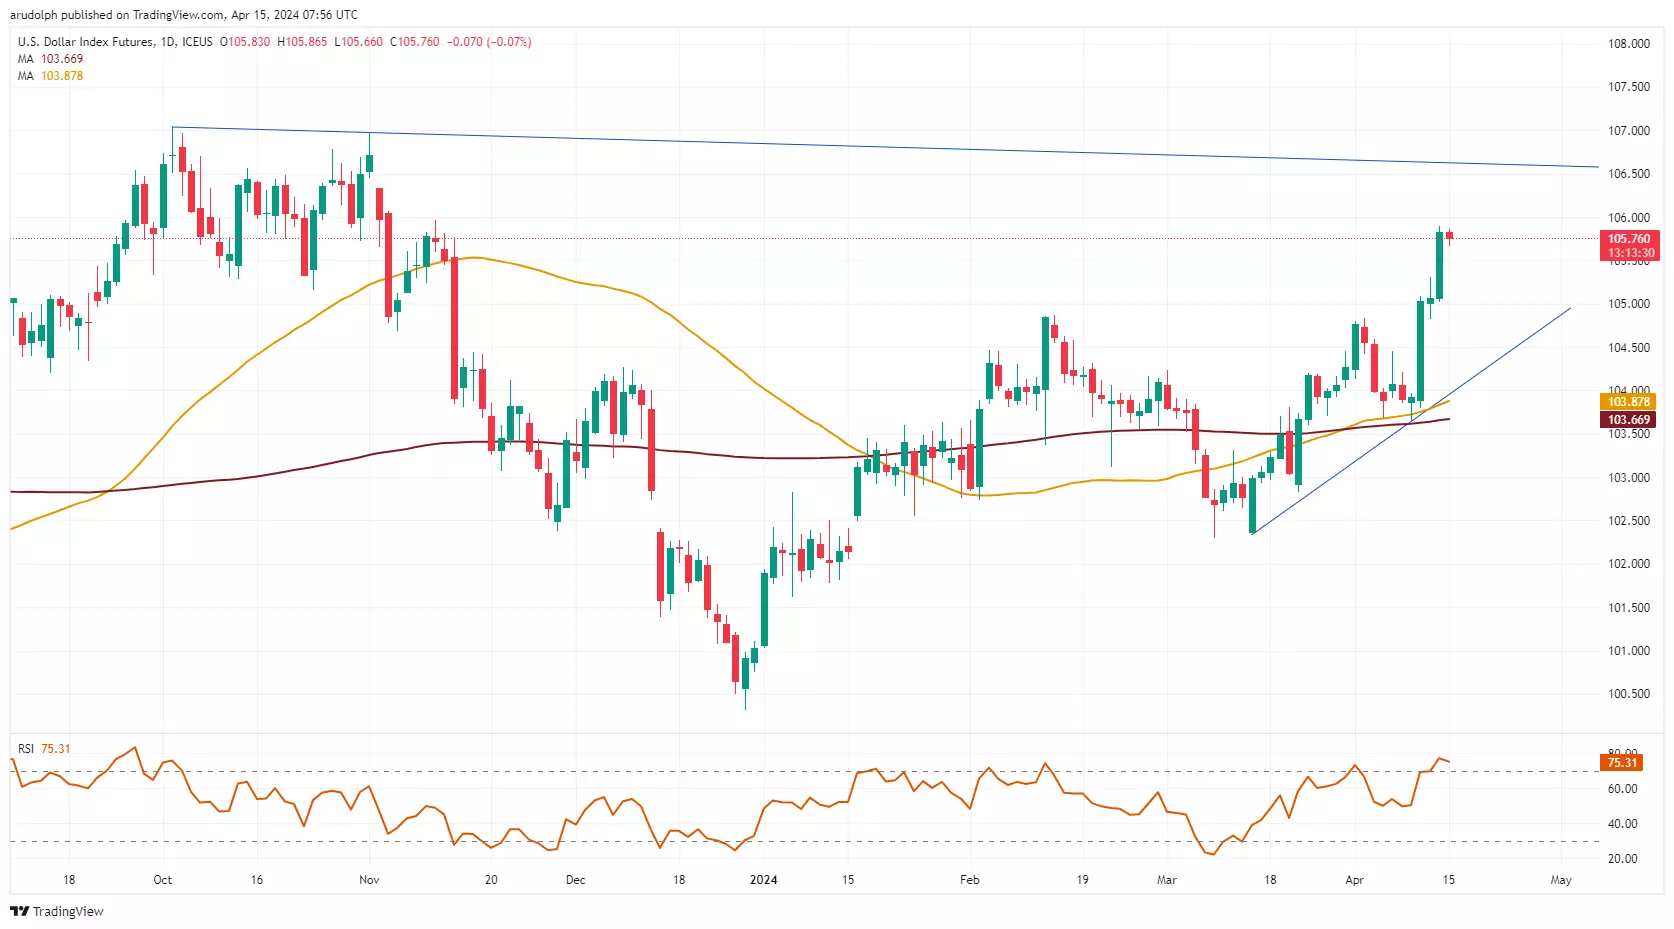
The fact that the US economy added 303K jobs in March 2024, the most in ten months, coupled with Consumer Price Inflations (CPI) coming in slightly higher-than-expected at 3.5% versus a 3.2% year-on-year increase in February, pushed US yields to five-month highs and led to the greenback appreciating.
Meanwhile US Federal Reserve (Fed) rate cut expectations have been pushed back from June and three rate cuts this year to September and two rate cuts, also boosting the greenback. This is because higher rates for longer make holding the US dollar more attractive than other currencies such as the euro of the British pound, for example, with the former expected to cut rates in June and the latter in August.
The missile and drone attacks by Iran on Israel over the weekend have led to flight-to-safety flows into the US dollar, leading to further appreciation of the currency.
The yen, despite investors expecting to see another rate hike at the Bank of Japan’s (BoJ) July monetary meeting, continues to take the brunt and is further depreciating versus the US dollar, hitting yet another 34-year high whilst on its way to its 1990 peak at ¥160.16.
USD/JPY Yearly Candlestick Chart
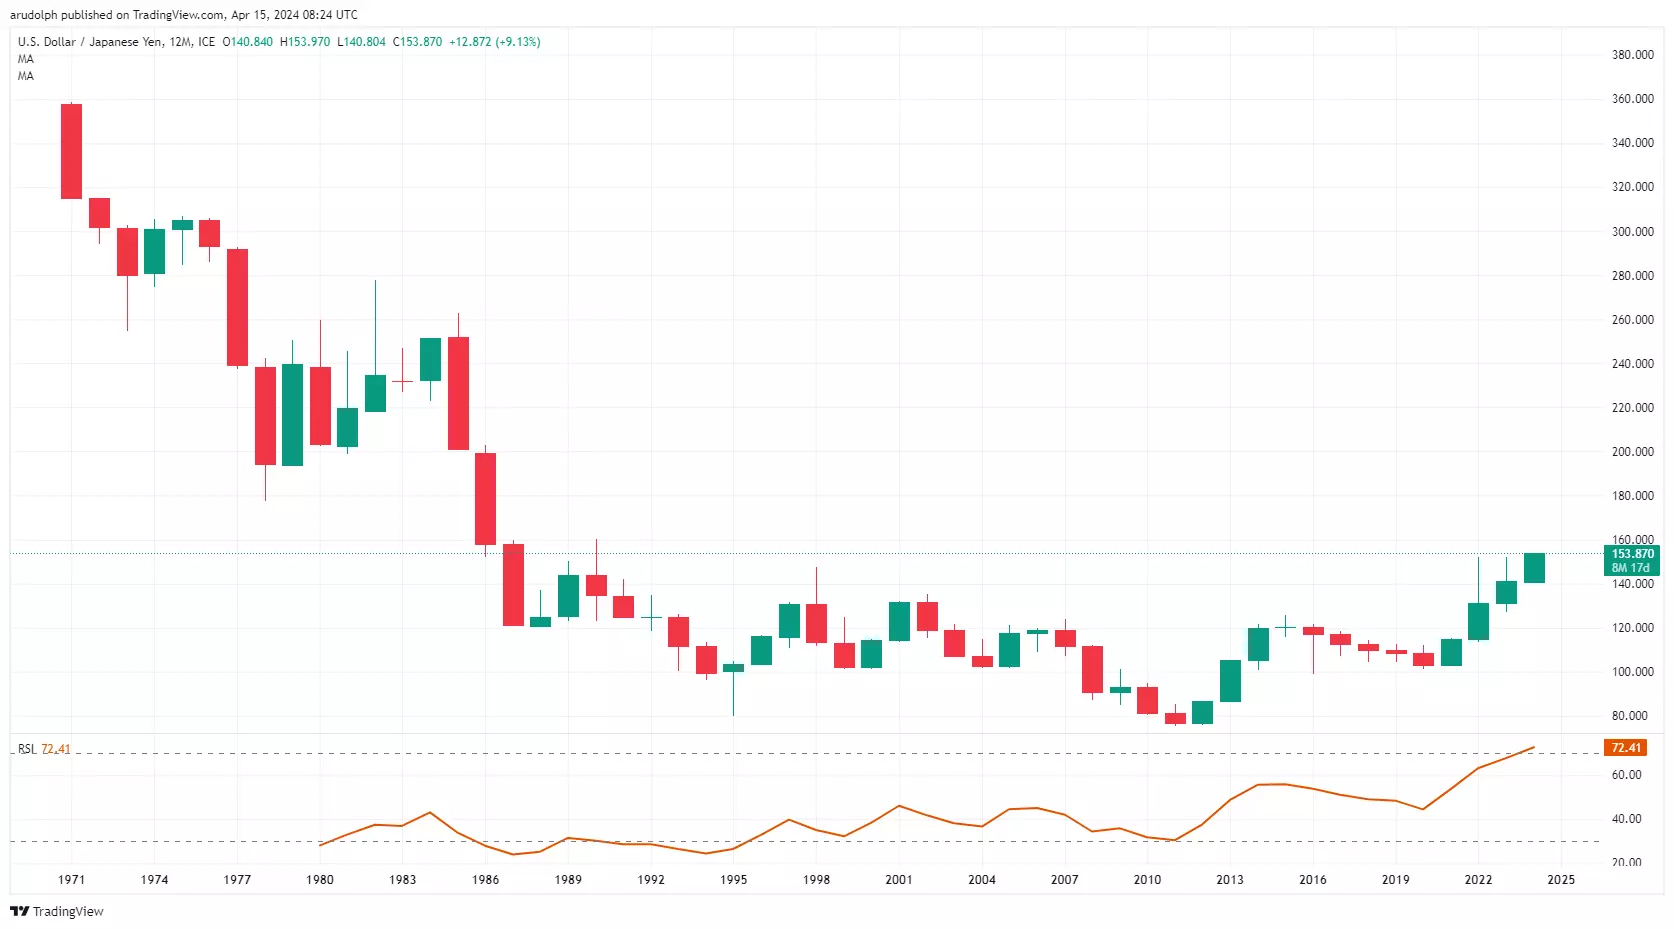
USD/JPY is thus on track for its fourth straight year of gains with further upside expected to be seen in the course of this year.
Versus the euro, the US dollar is also expected to appreciate further.
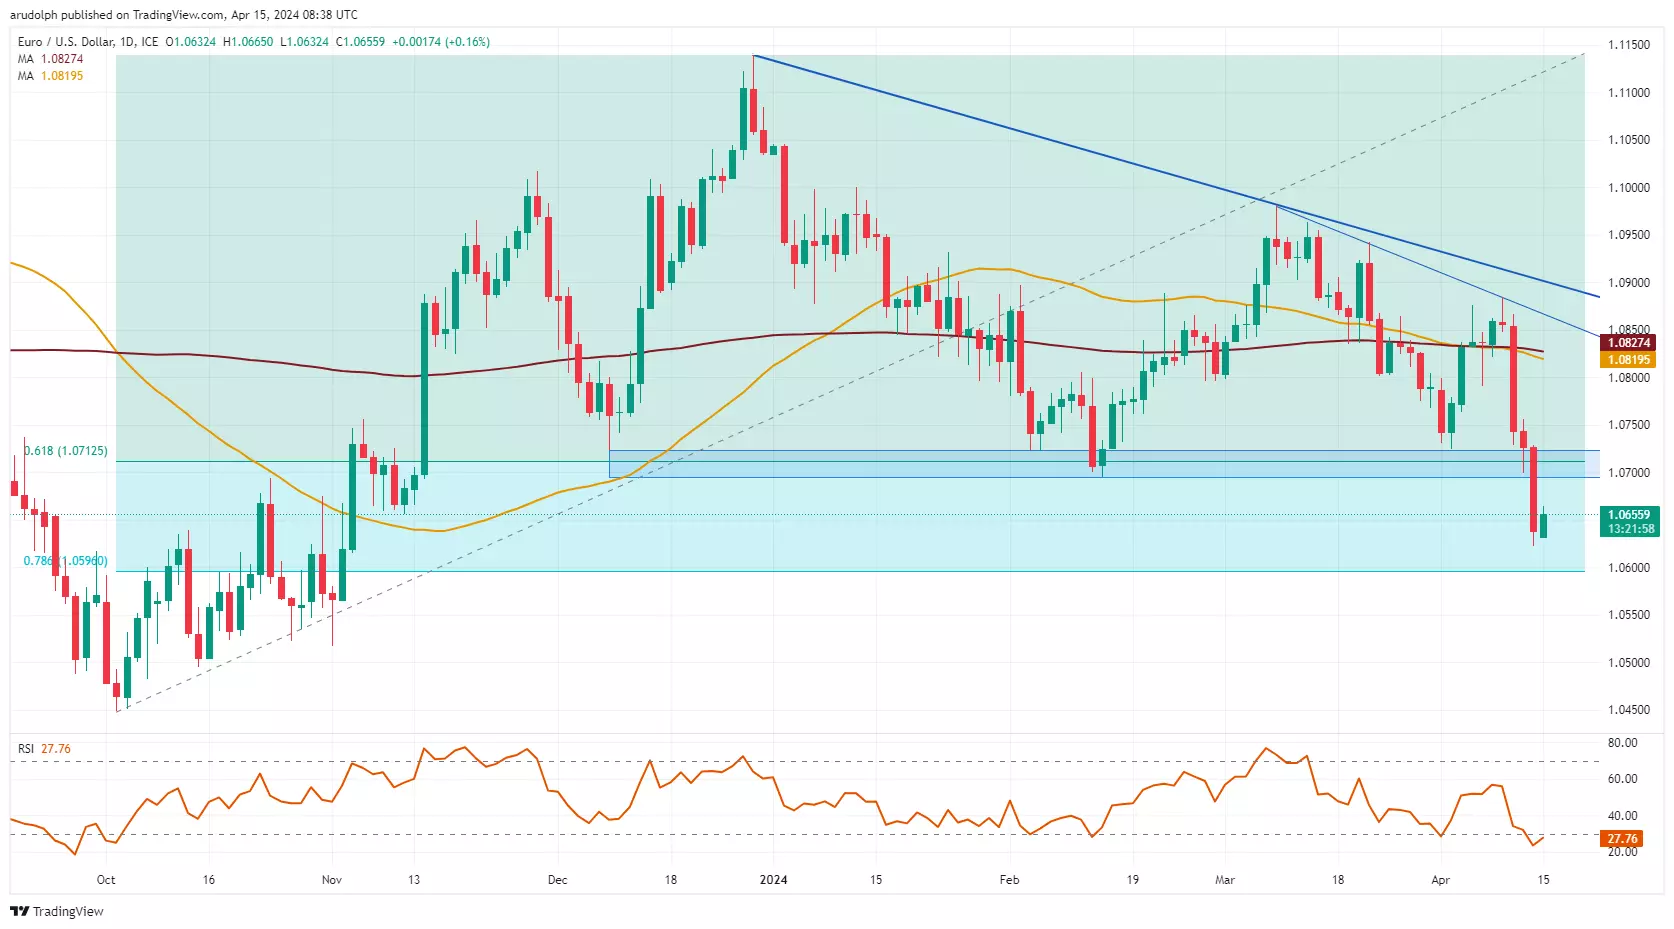
Last week’s fall through and weekly chart close below EUR/USD’s key $1.0725 to $1.0695 support zone, made up of the December-to-early April lows, is technically bearish and puts the October low at $1.0449 on the map. En route lies the 78.6% Fibonacci retracement of the October-to-December advance at $1.0596.
This bearish scenario will remain in play while no bounce in the cross takes it to above the major $1.0695 to $1.0725 resistance area.
EUR/USD Daily Candlestick Chart
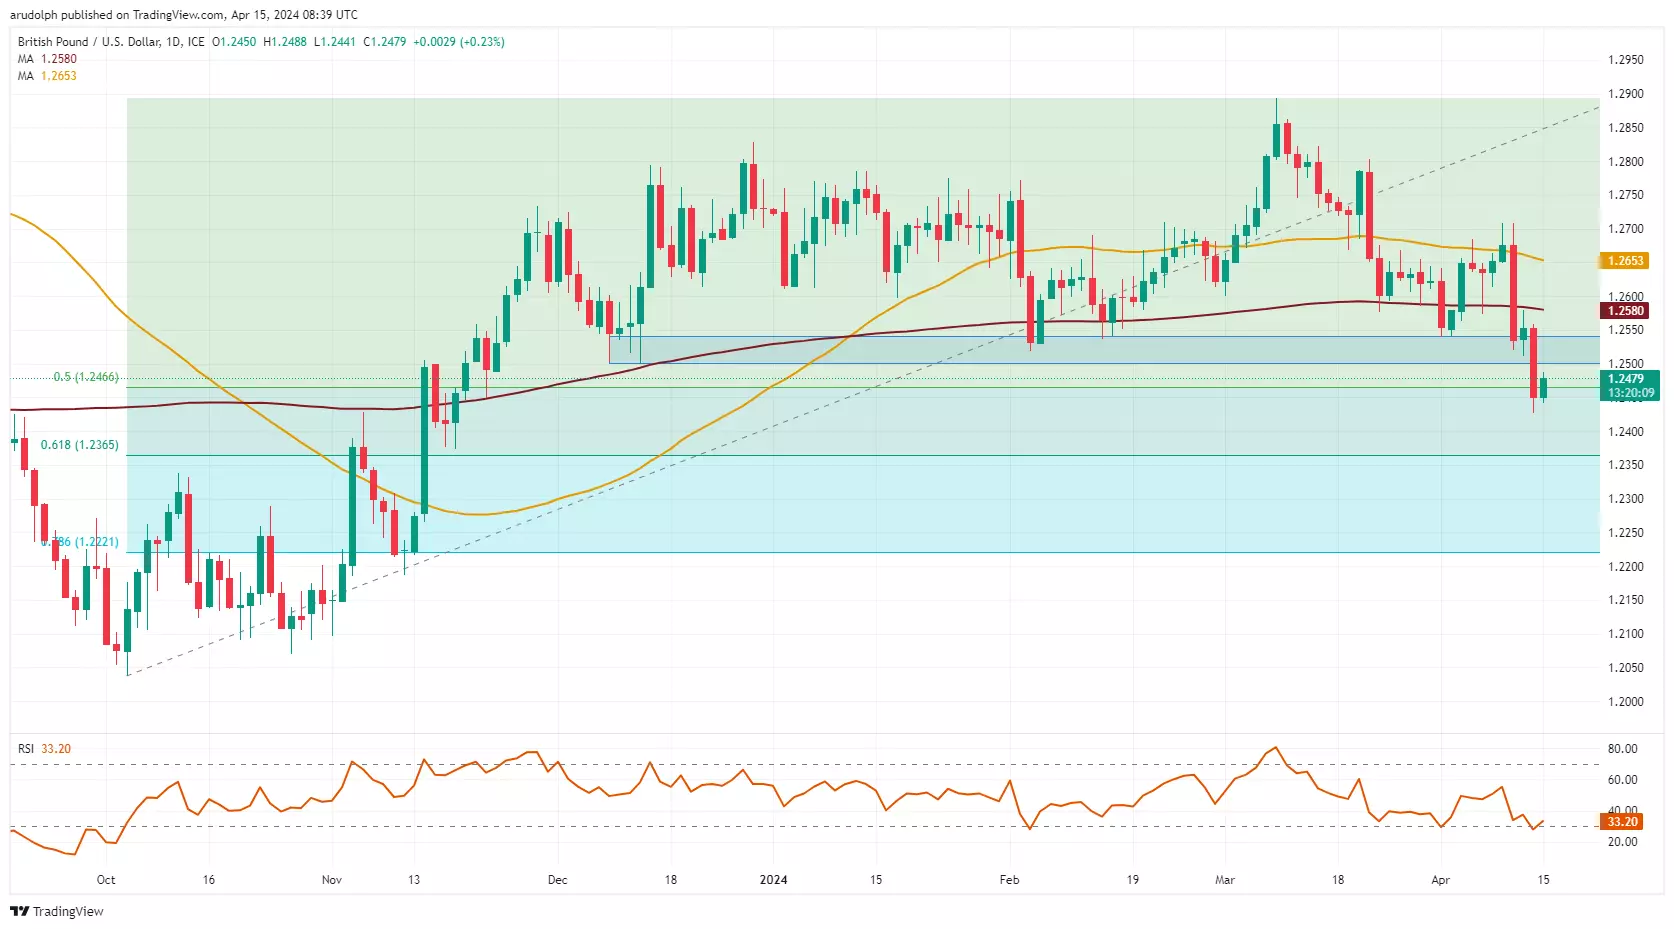
The technical picture is similar when it comes to GBP/USD, even though it is currently flirting with the 50% retracement of the October-to-March advance.
Nonetheless the currency pair also fell through its key support at $1.2540 to $1.2500, which encompasses the December-to-early April lows, and thus points towards further weakness towards the October-to-November lows at $1.2096 to $1.2038 unfolding.
On the way down the 61.8% Fibonacci retracement can be found at $1.2365 and represents the next downside target.
Only a rise and daily chart close above the, because of inverse polarity now resistance zone, at $1.2500 to $1.2540, and the 200-day simple moving average (SMA) at $1.2580 would negate the bearish GBP/USD outlook.
GBP/USD Daily Candlestick Chart
The information on this page does not contain a record of our trading prices, or an offer of, or solicitation for, a transaction in any financial instrument. IG Bank S.A. accepts no responsibility for any use that may be made of these comments and for any consequences that result. No representation or warranty is given as to the accuracy or completeness of this information. Consequently any person acting on it does so entirely at their own risk. Any research provided does not have regard to the specific investment objectives, financial situation and needs of any specific person who may receive it and as such is considered to be a marketing communication. Although we are not specifically constrained from dealing ahead of our recommendations we do not seek to take advantage of them before they are provided to our clients. See full non-independent research disclaimer.

Start trading forex today
Find opportunity on the world’s most-traded – and most-volatile – financial market
- Trade spreads from just 0.6 points on EUR/USD
- Analyse with clear, fast charts
- Speculate wherever you are with our intuitive mobile apps
See an FX opportunity?
Try a risk-free trade in your demo account, and see whether you’re onto something.
- Log in to your demo
- Take your position
- See whether your hunch pays off
See an FX opportunity?
Don’t miss your chance – upgrade to a live account to take advantage.
- Get spreads from just 0.6 points on popular pairs
- Analyse and deal seamlessly on fast, intuitive charts
- See and react to breaking news in-platform
See an FX opportunity?
Don’t miss your chance. Log in to take your position.
Live prices on most popular markets
- Forex
- Shares
- Indices
Prices above are subject to our website terms and agreements. Prices are indicative only. All shares prices are delayed by at least 15 mins.
