Hockey stick chart pattern explained
The hockey stick chart pattern is characterised by a period of flatness, followed by a sudden and rapid increase. Here, you’ll learn how to identify it, what it means for traders, and how to take a position when you spot it.


What is a hockey stick chart?
A hockey stick is a chart pattern that shows a rapid increase after a period of relative stability. Traders will often look for the pattern when assessing metrics such as a company’s sales volume or revenue growth which, in turn, could lead to a corresponding rise in share prices.
How to identify the hockey stick pattern
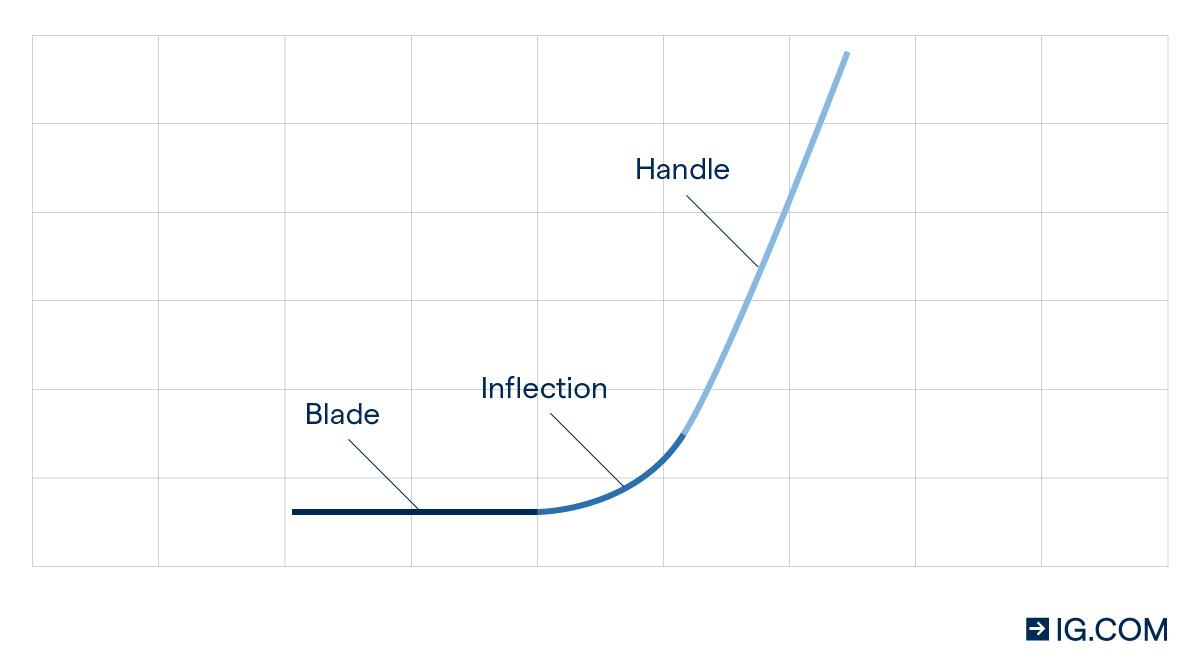
A hockey stick pattern can be identified by three distinct parts: the blade, the inflection, and the handle. Let’s go through each of these in turn.
The blade on a hockey stick chart is often a flat line, in which growth is slow, maybe even stagnant. The inflection is a curve from the blade, which represents an initial burst in growth. The handle comes after the inflection, and it shows sustained and expanding growth along an upwards trajectory.
What does a hockey stick chart pattern mean to traders?
To traders, a hockey stick pattern on a sales volume or revenue growth chart could indicate that there is heightened interest in a company’s products or services.
A rising sales volume would act as a potential indicator of an imminent increase in the company’s share price, as more and more consumers become interested in their products. That’s because more consumers would push up demand, which in turn, would cause revenues to increase as the company expands.
As the company expands and its revenues continue to grow, it would be expected that the company’s share price will also rise – presenting an opportunity for traders.
How to trade the hockey stick pattern
Many people will trade the hockey stick pattern by opening a long position if sales volumes are increasing. You could choose to go long with CFDs, which are financial derivatives that enable you to speculate on an asset’s price without having to directly own it.
Hockey stick chart pattern summed up
- The hockey stick chart pattern is indicative of a rapid increase in a certain metric
- A hockey stick chart pattern showing rising sales volumes could result in a similar increase in a company’s share price as revenue grows
- Traders will take a long position to speculate on rising share prices
- To trade the hockey stick pattern, open an account today
This information has been prepared by IG, a trading name of IG Limited. In addition to the disclaimer below, the material on this page does not contain a record of our trading prices, or an offer of, or solicitation for, a transaction in any financial instrument. IG accepts no responsibility for any use that may be made of these comments and for any consequences that result. No representation or warranty is given as to the accuracy or completeness of this information. Consequently any person acting on it does so entirely at their own risk. Any research provided does not have regard to the specific investment objectives, financial situation and needs of any specific person who may receive it. It has not been prepared in accordance with legal requirements designed to promote the independence of investment research and as such is considered to be a marketing communication. Although we are not specifically constrained from dealing ahead of our recommendations we do not seek to take advantage of them before they are provided to our clients.
CFDs are a leveraged products. CFD trading may not be suitable for everyone and can result in losses that exceed your initial deposit, so please ensure that you fully understand the risks involved.

Discover how to trade the markets
Explore the range of markets you can trade – and learn how they work – with IG Academy's free ’introducing the financial markets’ course.

